For visualizing lipid metabolism in live cells Imaging Reagents for Intracellular Lipid Metabolism
Date:August 21 2023Web Page No:70845

Funakoshi Co.,Ltd.
Lipid is a general term for molecules, including glycerolipids such as triglycerides, which are esters of fatty acids and glycerol, sphingolipids such as ceramide, and sterols such as cholesterol. Its functions are known to be involved in intracellular phenomena such as the organization of the cell membrane separating the interior of the cell from the extracellular environment, energy storage, and its function as a second messenger in signal transduction pathways.
In this article, unique lipid research products are introduced.
-25-metabolism_map.jpg)
Image of intracellular metabolism of fatty acids
* For more information, click on the diagram above or words below.
- To visualize lipid droplets ☞ LipiDye™Ⅱ
- To detect fatty acid oxidation ☞ FAOBlue™
- To monitor lipid metabolism ☞ LipiDye™-M
- To detect lipid peroxidation ☞ LipiRADICAL™ Green
- To observe membrane microenvironments ☞ LipiORDER™
Imaging of intracellular lipids and membrane lipid order
Imaging of Lipid droplets
Lipid droplets (LDs) are found in all eukaryotes and serve as reservoirs for neutral lipids, primarily triacylglycerols and cholesterol esters. The accumulation of LDs in cells is itself a normal phenomenon, since stored lipids are used for energy, steroid synthesis, or membrane formation.
Adipocytes contain large amounts of LDs, and the accumulation of excess LDs within the cell is an indicator of metabolic defects and etiologies. For example, excessive lipid accumulation in liver cells (lipidosis) can cause cellular dysfunction. At the onset of atherosclerosis, macrophages phagocytose oxidized LDL and develop into foam cells, resulting in arterial narrowing. In recent years, it has been reported that LDs are found not only in adipocytes but also in various other cell types, including hepatocytes, smooth muscle cells, and glial cells, and have various functions, such as metabolic control and regulation of gene expression, as well as their role as storage organs for neutral lipids, as classically known.
LDs have been observed in a variety of cells, and it is known that LDs in non-adipocytes are less than 1 μm in diameter and much smaller than those in adipocytes (10~100 μm). The imaging reagent for the observation of small LDs in non-adipocyte has been expected, since existing reagents such as Nile Red stain other than LDs (low signal-to-noise ratio) and are unsuitable for live cell imaging and the observation method of small LDs has been limited to electron microscopy.
-5L-image.jpg)
-24L-image.jpg)
-image.jpg)
Check it out! LipiDye™Ⅱ
LipiDye™Ⅱ is highly sensitive lipid droplet staining reagent for long-term live cell imaging. In addition to its high lipid droplet specificity, LipiDye™Ⅱ shows low toxicity and extremely high photostability, making it useful for long-term observation over several days, live cell imaging of lipid droplet fusion and degradation processes, and visualization of small LDs using STED super resolution microscopy.
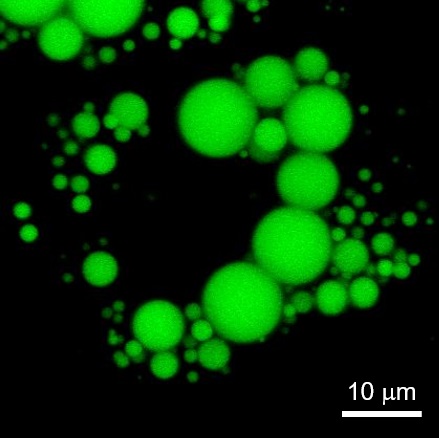
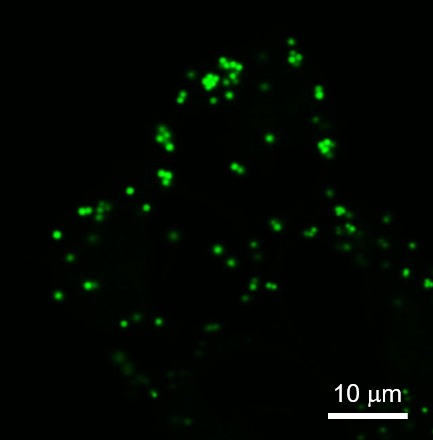
For more detail, please ☞ click here.
Imaging of fatty acid beta-oxidation activity
Fatty acids (FAs) are basic building blocks for wide variety of lipids, essential components of cells, and are one of primary sources of energy. Especially during starvation (glucose is shortage), a large amount of ATP is produced through the active degradation of fatty acids. There are various types of fatty acids with different carbon chain lengths and degrees of unsaturation and the FAs are mainly degraded in common degradation pathway in mitochondria called fatty acid beta-oxidation (FAO). In the pathway, FAs are converted to acyl-CoA form by acyl-CoA synthetase family and the acyl-CoA forms are incorporated into mitochondria. Once acyl-CoA entering to mitochondrial matrix, acyl-CoA (Cn) is converted to acyl-CoA (Cn-2) and acetyl-CoA by four stepwise reactions: 1) oxidation of the fatty acid β-position, 2) hydration of the β-position, 3) oxidation of the β-position, and 4) cleavage to form a fatty acid with two short carbons (acyl-CoA (Cn-2) and acetyl-CoA. The resulting acyl-CoA (Cn-2) enters another cycle of FAO to further produce acyl-CoA (Cn-4) and acetyl-CoA, and this cycle continues until the entire chain of acyl-CoA is converted into acetyl-CoA. Acetyl-CoA is further converted to ATP. It has been reported that the FAO activity is highly variable in diseases such as cancer and non-alcoholic steatohepatitis (NASH), and the development of a method to measure FAO activity has been expected.
-3-image.jpg)
Click to enlarge image( )
)
Fatty acid beta-oxidation:FAO
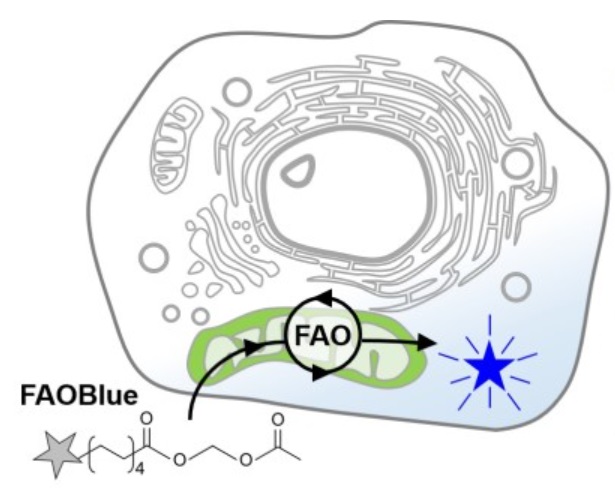
Check it out! FAOBlue™
FAOBlue™ is the world-first reagent that measures fatty acid β-oxidation (FAO) activity, a common pathway for fatty acid degradation, using blue fluorescence. Though it has been difficult to measure FAO activity in living cell, FAOBlue™ enables to measure FAO activity with an easy procedure in living cells by fluorescence imaging. FAOBlue™ is useful for comparative evaluation of FAO activity between different cell types, screening of compounds that promote or inhibit FAO activity, and basic research of enzymes related to FAO etc.
-14L-image.jpg)
-15L-image.jpg)
FAOBlue™ is taken up into the cell and releases the blue fluorescent dye into the cytoplasm by FAO activity in mitochondria, resulting in whole-cell blue fluorescence. As the FAO inhibitors suppress the generation of blue fluorescence, it indicates that FAOBlue™ is specifically reactive to FAO.
For more detail, please ☞ click here.
Intracellular distribution imaging of fatty acid metabolites
Fatty acids (FAs) are the smallest units of lipids and are converted into various lipids including acyl-CoA, phospholipids, glycolipids, diacylglycerol (DAG) and triacylglycerol (TAG) in the cell. Lipid metabolism is strictly regulated by various enzymes in the cell, and its abnormal regulation induces diseases. In understanding lipid metabolism, especially FA metabolism, fluorescent dye-labeled FAs have been employed with fluorescent imaging techniques. Although these FA-derivatives contribute to evaluating intracellular lipid metabolism, the conventional fluorescent dyes cannot distinguish lipid metabolites and their localization as their fluorescent properties hardly change during the metabolism process.
Check it out! LipiDye™-M
LipiDye™-M can be taken up to cells by FA-transporters and converted into many types of lipids. The lipids are transferred to the appropriate localization sites for each lipid and change their fluorescent colors according to the polarity of surrounding environment, as shown in the figure below. LipiDye™-M is a novel fluorescently labeled fatty acid to monitor lipid metabolism.
-20-image.jpg)
-21-A-image.jpg)
LipiDye™-M is an environment-responsive dye-labeled fatty acid that changes its fluorescence depending on its lipid structure and localization during the intracellular lipid metabolism after uptake into the cell by FA-transporters. By merging images from a green channel and red channel, the state of lipid metabolism can be shown in three colors.
|
Click to enlarge image( Scheme of LipiDye™-M metabolites and fluorescent color |
|
Click to enlarge image ( Three colors merged imaging for LipiDye™-M metabolites |
-22-image.jpg)
-25-image.jpg)
For more detail, please ☞ click here.
Imaging of lipid peroxidation reactions
-4R-image.jpg)
Check it out! LipiRADICAL™ Green
LipiRADICAL™ Green is a fluorescent detection reagent specific for lipid radicals, which are upstream factors in lipid peroxidation reactions. It can be used for live cell imaging, relative quantification of lipid radicals in samples, and structural analysis and comprehensive identification of lipid radicals in samples.
-16-image.jpg)
-17-image.jpg)
For more detail, please ☞ click here.
Imaging of the phase state (Lipid order) of biological membranes
-2L-image.jpg)
Click to enlarge image()
Overview of membrane lipid order
There are variety types of lipids included in biological membrane and the state of membrane differ depending on the lipid composition. For example, phospholipids only containing saturated lipids create high packing and thick lipid bilayer, called liquid-order (Lo) phase. On the other hand, phospholipids containing unsaturated lipids form low packing and thin membrane structure, called liquid-disorder (Ld) phase. The microenvironment of lipids like Lo and Ld is called Lipid order. While Lo and Ld are clearly separated and create individual domains in the simple model, the lipid order reflects the total properties of the state, rather than the simple phase separation as in the model in the figure because the actual cells have numerous types of lipids. As the lipid order is also considered to be influenced by membrane proteins, the actual membrane lipid order is very complicated. Lo on cell membranes is also called lipid rafts and is interest topic as functional domains of biological membranes. Therefore, the development of a simple imaging method to analyze the membrane lipid order has been expected to understand the biophysical properties of cell membranes, such as fluidity and stiffness.
Check it out! LipiORDER™
LipiORDER™ is an environment-responsive fluorescent dye (solvatochromic dye) that enables quantitative observation of the phase state (lipid order) Lo/Ld of cell membranes by imaging. LipiORDER™ exhibits high chemical stability in living cells and can be used to observe the lipid order of various membrane structures such as cell membranes and intracellular membranes.
-12L-image.jpg)
Click to enlarge image()
Graphical image of LipiORDER™ and Typical ratio imaging of cultured neurons
For more detail, please ☞ click here.
CONTACT
export@funakoshi.co.jp
- ※Prices on our website are for your reference only. Please inquire your distributor for your prices.
- ※Please note that Product Information or Price may change without notice.