HOME>
Products>
Natural and Chemical compound>
LipiDye™Ⅱ
HOME>
Products>
Cell Culture>
Imaging dye>
LipiDye™Ⅱ
Live imaging fluorescent dye for lipid droplets (LDs) LipiDye™Ⅱ
Date:January 23 2018Web Page No:80682

Funakoshi Co.,Ltd.
LipiDye™Ⅱ is a highly sensitive lipid droplets staining reagent for long-term live cell imaging. In addition to its high lipid droplets specificity, LipiDye™Ⅱ shows low toxicity and extremely high photostability, making it useful for long-term observation, live cell imaging of lipid droplet fusion and degradation processes, and visualization of small LDs using STED super resolution microscopy.

Background
What is lipid droplet?
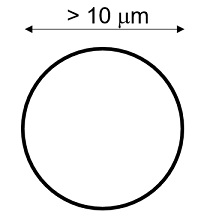
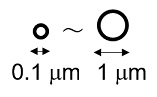
Lipid droplets (LDs) are organelles that are historically found in adipocytes and have a unique phospholipid monolayer and store neutral lipids such as triglycerides and sterol esters (Below figure left). LDs are thought to act as intracellular neutral lipid storage organs, and are often reported to be associated with obesity and diseases. In recent years, it has been reported that LDs are found not only in adipocytes but also in various other cell types, including hepatocytes, smooth muscle cells, and glial cells, and have various functions, such as metabolic control and regulation of gene expression, as well as their role as storage organs for neutral lipids, as classically known. LDs have been observed in a variety of cells, and it is known that LDs in non-adipocytes are less than 1 μm in diameter and much smaller than those in adipocytes (10-100 μm). The imaging reagent for the observation of small LDs in non-adipocyte has been expected, since existing reagents such as Nile Red stain other than LDs (low signal-to-noise ratio) and are unsuitable for live cell imaging and the observation method of small LDs has been limited to electron microscopy.
LipiDye™Ⅱ
Funakoshi provides a green fluorescent dye LipiDye™(#FDV-0010), which shows high sensitivity and selectivity for LDs and can detect approximately 1 μm sizes of LDs. Although LipiDye™ is a powerful tool to monitor small LDs in non-adipocytes, it isn’t suitable for long-term live cell imaging due to its photostability. LipiDye™Ⅱ is a novel lipid droplet detection reagent developed to overcome these issues. LipiDye™Ⅱ exhibits extremely high photostability and enables stable live cell imaging for a long time with low toxicity.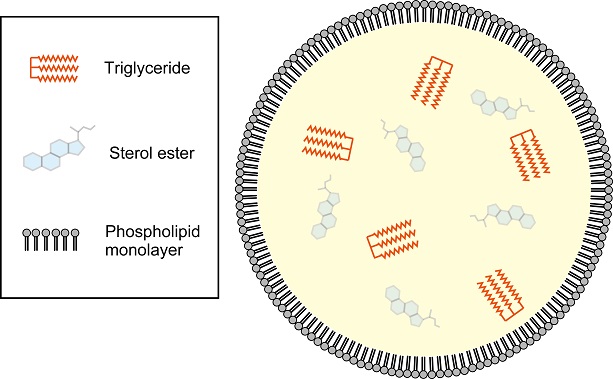

Features
- In addition to the selective enrichment to LDs, ☞ the fluorescent dye emits light in response to a hydrophobic environment, thus suppressing emission in the cytoplasm, etc. and showing a high signal-to-noise ratio for LDs.
- Capable of ☞ detecting small LDs (<1 μm) in non-adipocytes.
- It exhibits ☞ extremely high photostability and is excellent for long-time live cell imaging.
- Since it does not fade, it can be used for fluorescent observation of the lipid droplet degradation process.
- At the recommended use concentration (0.1-1 μM), it shows almost ☞ no cytotoxicity. With the reagent added, ☞ the adipocyte differentiation process has been observed for up to 8 days.
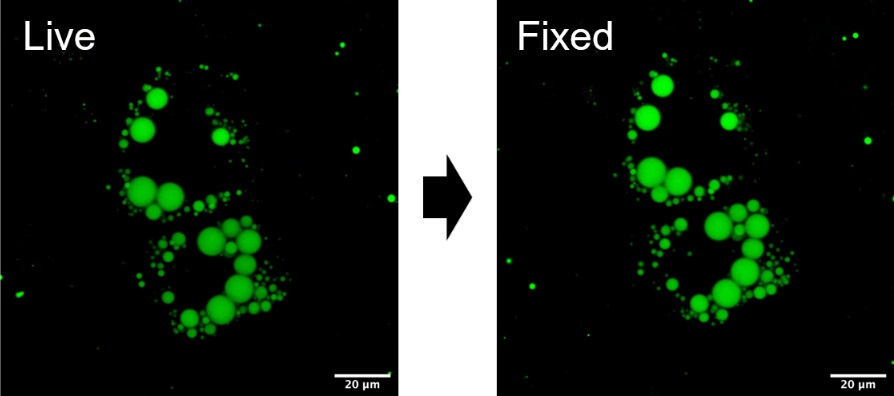
- Can be used for both live cells and fixed cells. ☞ Fixation treatment after staining of living cells is also possible.
- Applicable to STED super resolution microscopy. ☞ LD of about 200 nm (FWHM) were observed.
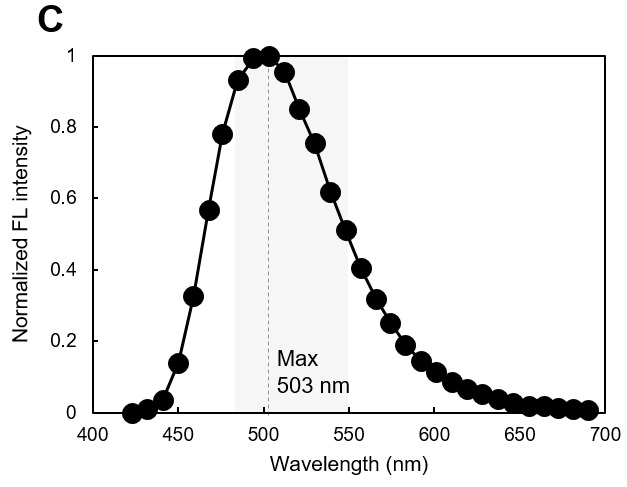
- Excitation/Fluorescence wavelengths: 400-500 nm / 490-600 nm (See below)
Fluorescence wavelengths (excitation and detection wavelengths)
- Absorption maxima are 410 to 420 nm, but excitation is also possible with light sources in the 450 to 500 nm region. For details, please refer to ☞ excitation and fluorescence spectrum.
- Two-photon excitation with an 800 nm laser is available. For details, please refer to ☞ observation of microglia using two-photon microscopy.
- Multiple staining is possible, but wavelengths should be selected carefully. A dye with an excitation light of 500 nm or higher is recommended; if a common blue fluorescent dye that excites at 450 nm or lower is used, LipiDye™Ⅱ may be excited at the same time.
Light source example
- Blue excitation lasers: 405, 445, 458, 473 and 488* nm lasers
- Light source (Xenon lamp or LED) + filters: Common FITC and GFP filters are available
- STED super resolution microscopy: Recommended excitation light: 473 nm laser, STED light: 660 nm laser
Superiority
| Name | Color | Excitation light | Staining for fixed cells | Staining for live cells | Multicolor imaging | S / N ratio | Photo-stability | Time-lapse imaging |
|---|---|---|---|---|---|---|---|---|
| LipiDye™Ⅱ | Green fluorecence | 400-500 nm | 〇 | 〇 | 〇 | High | Extremely High | ◎ |
| LipiDye™ | Green fluorecence | 400-470 nm | 〇 | 〇 | 〇 | High | High | 〇 |
| Fluorecent dye B | Green fluorecence | ≦ 480 nm | 〇 | 〇 | 〇 | Middle | Low | 〇 |
| Nile Red | Red fluorecence | ≦ 510 nm | 〇 | 〇 | △ | Low | Low | △ |
| LDs staining dye A | Red・Green fluorecence | - | ✕ | 〇 | 〇 | High | - | ✕ |
| Oil Red O | Red fluorecence | - | ✕ | 〇 | - | Low | - | ✕ |
Reference Data
Excitation / Fluorescence spectrum


Photostability of LipiDye™Ⅱ in the cell

Cytotoxicity of LipiDye™Ⅱ

Comparison of the fluorescence intensity under live cell and after PFA fixation
Application Data
Staining of various cells
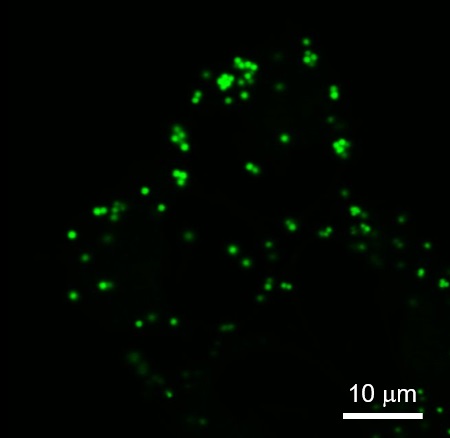
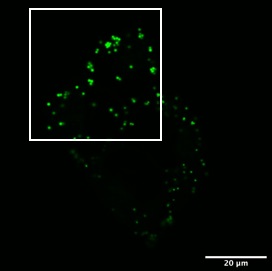
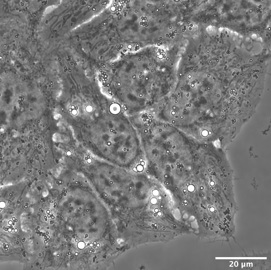
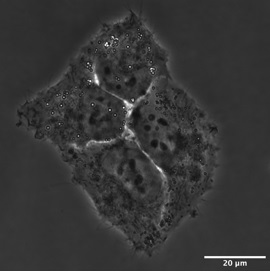
3T3-L1, HepG2, COS-7 and HeLa cells were stained with LipiDye™Ⅱ (1 µM) and observed by confocal microscopy (Ex. 473 nm/Em 490-540 nm). In the case of HepG2, cells were pretreated with fatty acids for one day before LipiDye™Ⅱ staining. In HeLa cells, small LDs of approximately 1 µM were clearly observed. (Scale bar: 20 µm, HeLa cell enlarged 5 µm).
3T3-L1, HepG2, COS-7 and HeLa cells were stained with LipiDye™Ⅱ (1 µM) and observed by confocal microscopy (Ex. 473 nm/Em 490-540 nm). In the case of HepG2, cells were pretreated with fatty acids for one day before LipiDye™Ⅱ staining. In HeLa cells, small LDs of approximately 1 µM were clearly observed. (Scale bar: 20 µm, HeLa cell enlarged 5 µm).
| 3T3-L1 | HepG2 | Cos7 | HeLa | |
 |
 |
 |
 |
 |
 |
 |
 |
 |
|
Multicolor imaging with ER marker
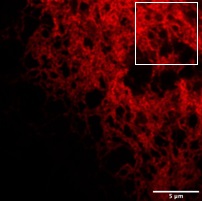
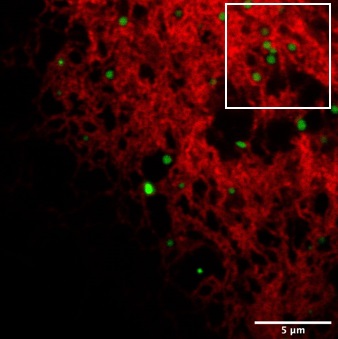
COS7 cells expressing ER-resident red fluorescent protein (ER-mKO1) were stained with LipiDye™Ⅱ(1 uM) and observed by confocal microscopy (LipiDye™Ⅱ; Ex 473 nm/Em 490-540 nm, ER-mKO1; Ex 635 nm/Em 660-710 nm). Small LDs less than 1 um were frequently observed in the network structure of ER. (Scale bar: 20 um, 5 um and 1 um). This result correlates well with the fact that LDs are biosynthesized from the ER.
| LipiDye™Ⅱ | ER | Merge | |
 |
 |
 |
|
 |
 |
 |
 |
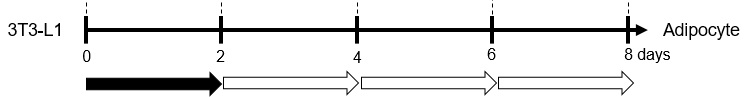
Long-term staining during adipocyte differentiation and maturation
Lipid droplet maturation of 3T3-L1 preadipocytes induced to differentiate into adipocytes was observed by confocal microscopy using LipiDye™Ⅱ (1 uM) for 8 days (Ex 473 nm / Em 490-540 nm). 3T3-L1 cells were cultured in differentiation medium containing LipiDye™Ⅱ (1 uM) for 2 days and then the medium was replaced with maintenance medium containing LipiDye™Ⅱ (1 uM) every 2 days. The adipocyte maturation process could be observed even after long-term treatment with LipiDye™Ⅱ without any cytotoxicity or effect on adipocyte differentiation.
 |
 |
 |
 |
 |
||
 |
||||||
| 1 μM LipiDye™Ⅱ in differentiation medium |
1 μM LipiDye™Ⅱ in maintain medium |
1 μM LipiDye™Ⅱ in maintain medium |
1 μM LipiDye™Ⅱ in maintain medium |
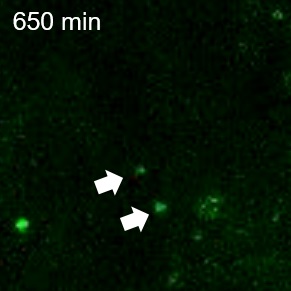
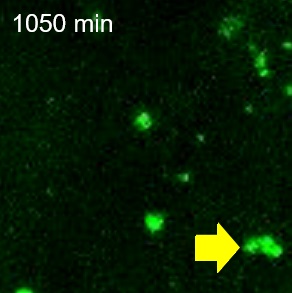
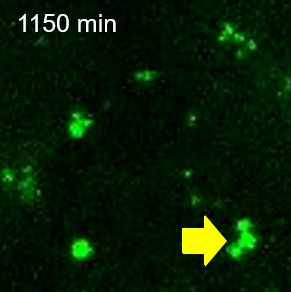
Dynamic behavior analysis of newly formed LDs by live cell imaging
Newly formed LDs of 3T3-L1 preadipocytes during induction of differentiation into adipocytes were observed by long time-lapse imaging (Z-stack imaging) for about 24 hours (confocal microscopy: excitation 473 nm / fluorescence 490-540 nm, 20 z-images/10 min). Time-lapse imaging was started immediately after the addition of differentiation medium (containing LipiDye™Ⅱ) to 3T3-L1 previously stained with LipiDye™Ⅱ. After ~10 hours differentiation, small LDs were observed (650 min, ⇨) and some LDs were docking with other LDs during adipogenesis (950-1450 min, ➡). (Scale bar; 1 um).
 |
 |
 |
 |
 |
 |
 |
 |
Time-lapse Z-stack imaging of lipolysis and lipogenesis
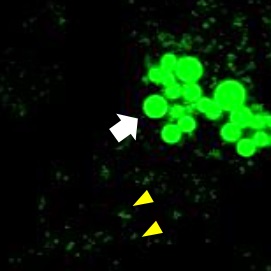
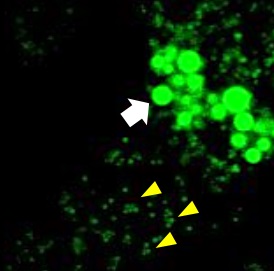
After the differentiated 3T3-L1 cells were treated with forskolin (10 μM), an activator of adenylyl cyclases, and IBMX (100 nM), an inhibitor of phosphodiesterases, time-lapse Z-stack imaging (15 z-images/4 min, for 800 min) were performed by confocal microscopy (Ex. 473 nm/Em 490-540 nm) to observe the lipid droplet shrinkage process associated with triacylglycerol degradation. Some large LDs clearly contracted (⇨) and numerous newly formed small LDs were observed (◄) in a time-dependent manner.
Since the high photostability and high S/N ratio of the LipiDye™Ⅱ allows us to observe even the smallest newly formed LDs, the increase and decrease of LDs can be quantitatively observed.
After the differentiated 3T3-L1 cells were treated with forskolin (10 μM), an activator of adenylyl cyclases, and IBMX (100 nM), an inhibitor of phosphodiesterases, time-lapse Z-stack imaging (15 z-images/4 min, for 800 min) were performed by confocal microscopy (Ex. 473 nm/Em 490-540 nm) to observe the lipid droplet shrinkage process associated with triacylglycerol degradation. Some large LDs clearly contracted (⇨) and numerous newly formed small LDs were observed (◄) in a time-dependent manner. Since the high photostability and high S/N ratio of the LipiDye™Ⅱ allows us to observe even the smallest newly formed LDs, the increase and decrease of LDs can be quantitatively observed.
| Forskolin + IBMX | |||
| 0 min | 160 min | 320 min | 480 min |
 |
 |
 |
 |
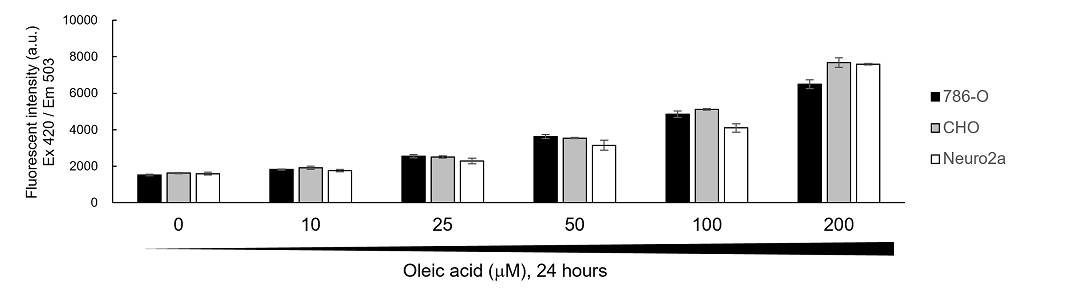
Semi-quantitative analysis of cellular lipid droplets by fluorescent plate reader
Three cell lines (human renal cancer cell line 786-O, mouse neuroblastoma cell line Neuro2a, and Chinese hamster ovarian cell line CHO) were seeded in 96 well plate at 1 x 10⁴ cell/well and cultured in DMEM containing 10% FBS (10% FBS/DMEM). After 24 hours, cells were treated with 10-200 uM oleic acid in 10% FBS/DMEM for further 24 hours to promote growth of lipid droplets. After washing cells, the cells were stained by 5 uM LipiDye™Ⅱ-containing 2% FBS/DMEM for 2 hours. Just before fluorescent plate leader measurement, cells were washed by PBS twice and fluorescent intensity (Ex 420 ±5 nm/Em 503 ±10 nm) of each well was measured. In all cell lines, oleic acid dose-dependency was observed.
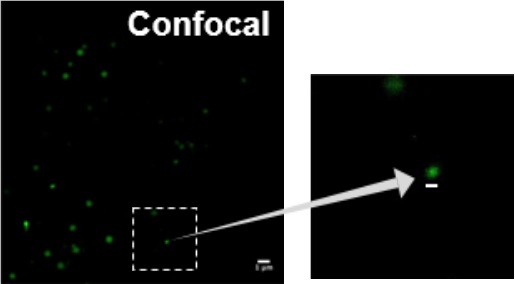
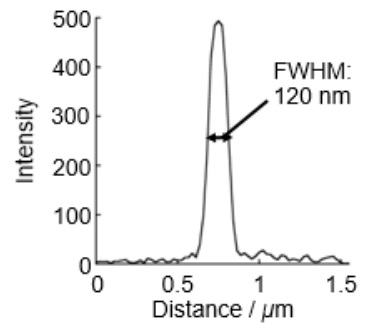
Live-cell STED super resolution microscopy imaging of small LDs
HeLa cells were treated with 1 uM LipiDye™Ⅱ and small LDs were imaged by confocal microscopy (Ex 473 nm/Em 490-540 nm) and STED microscopy (Ex 473 nm/Em 500-640 nm, depletion laser 660 nm). STED imaging detected ≦120 nm (FWHM) small LD, which was not clearly detected by confocal microscopy. Detailed STED imaging condition and analysis methods were described in original paper below.
 |
 |
||
 |
 |
||
Observation of microglia using two-photon microscopy
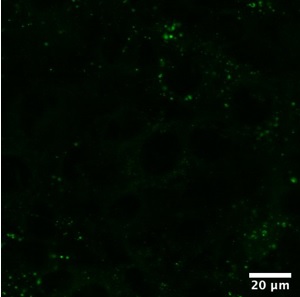
LipiDye™Ⅱ (1 uM) was added to primary cultured rat microglia, stained overnight, fixed with 4% PFA, and observed with two-photon microscopy (Ex 800 nm /Em 510-560 nm). LipiDye™Ⅱ can also be excited by two-photon excitation method and LDs of various sizes in primary cultured microglia could be detected.
 |
 |
 |
*Data courtesy of Dr. Hyun Beom Choi and Dr. Brian MacVicar, The University of British Columbia.
Original Paper
- Taki, M., et al., "Fused Thiophene-S,S-dioxide-Based Super-Photostable Fluorescent Marker for Lipid Droplets.", ACS Mater. Lett., 3(1), 42~49 (2021). (☞
 )
)
Product Information
[Date : July 29 2026 00:08]
| Detail | Product Name | Product Code | Supplier | Size | Price | ||||||||||||||||||||||||||||||
|---|---|---|---|---|---|---|---|---|---|---|---|---|---|---|---|---|---|---|---|---|---|---|---|---|---|---|---|---|---|---|---|---|---|---|---|
|
LipiDye II, Lipid Droplet Live Imaging DatasheetThis may not be the latest data sheet. |
FDV-0027 | FNAFunakoshi Co.,Ltd. | 0.1 mg | $350 | |||||||||||||||||||||||||||||||
|
|
|
||||||||||||||||||||||||||||||||||
|
LipiDye II, DMSO Solution |
FDV-0027S | FNAFunakoshi Co.,Ltd. | 25 µl | $170 | |||||||||||||||||||||||||||||||
|
|
|
||||||||||||||||||||||||||||||||||
[Date : July 29 2026 00:08]
LipiDye II, Lipid Droplet Live Imaging
DatasheetThis may not be the latest data sheet.
- Product Code: FDV-0027
- Supplier: FNA
- Size: 0.1mg
- Price: $350
| Description |
A highly sensitive lipid droplets staining reagent for long-term live cell imaging. |
||
|---|---|---|---|
| Storage | RT | CAS | |
| Link | |||
LipiDye II, DMSO Solution
- Product Code: FDV-0027S
- Supplier: FNA
- Size: 25µl
- Price: $170
| Description |
DMSO solution type (concentration: 1 mM) of lipid droplet staining reagent with high sensitivity for long-time live-cell imaging. In addition to high lipid droplet specificity, it has low toxicity and extremely high photostability. It is useful for long-time observation of several days, live-cell imaging of lipid droplet fusion and disassembly processes, and visualization of ultra-small lipid droplets by ultra-high-resolution microscopy. (excitation 400-500 nm/fluorescence 490-550 nm). |
||
|---|---|---|---|
| Storage | -20°C | CAS | |
| Link |
|
||
You may also like
-25-metabolism_map.jpg)
CONTACT
export@funakoshi.co.jp
- ※Prices on our website are for your reference only. Please inquire your distributor for your prices.
- ※Please note that Product Information or Price may change without notice.