Visualizing lipid metabolism on live cells by three color fluorescent imaging LipiDye™-M: Lipid Metabolism Tracer
Date:July 28 2022Web Page No:95027

Funakoshi Co.,Ltd.
LipiDye™-M is a fatty acid labeled with a novel solvatochromic dye. As LipiDye™-M exhibits green-to-red fluorescence depending on its lipid structure and its localization, LipiDye™-M can trace status of cellular fatty acid uptake and lipid metabolism in cells. It is a powerful tool for both basic research and pharmaceutical research for lipid metabolism.
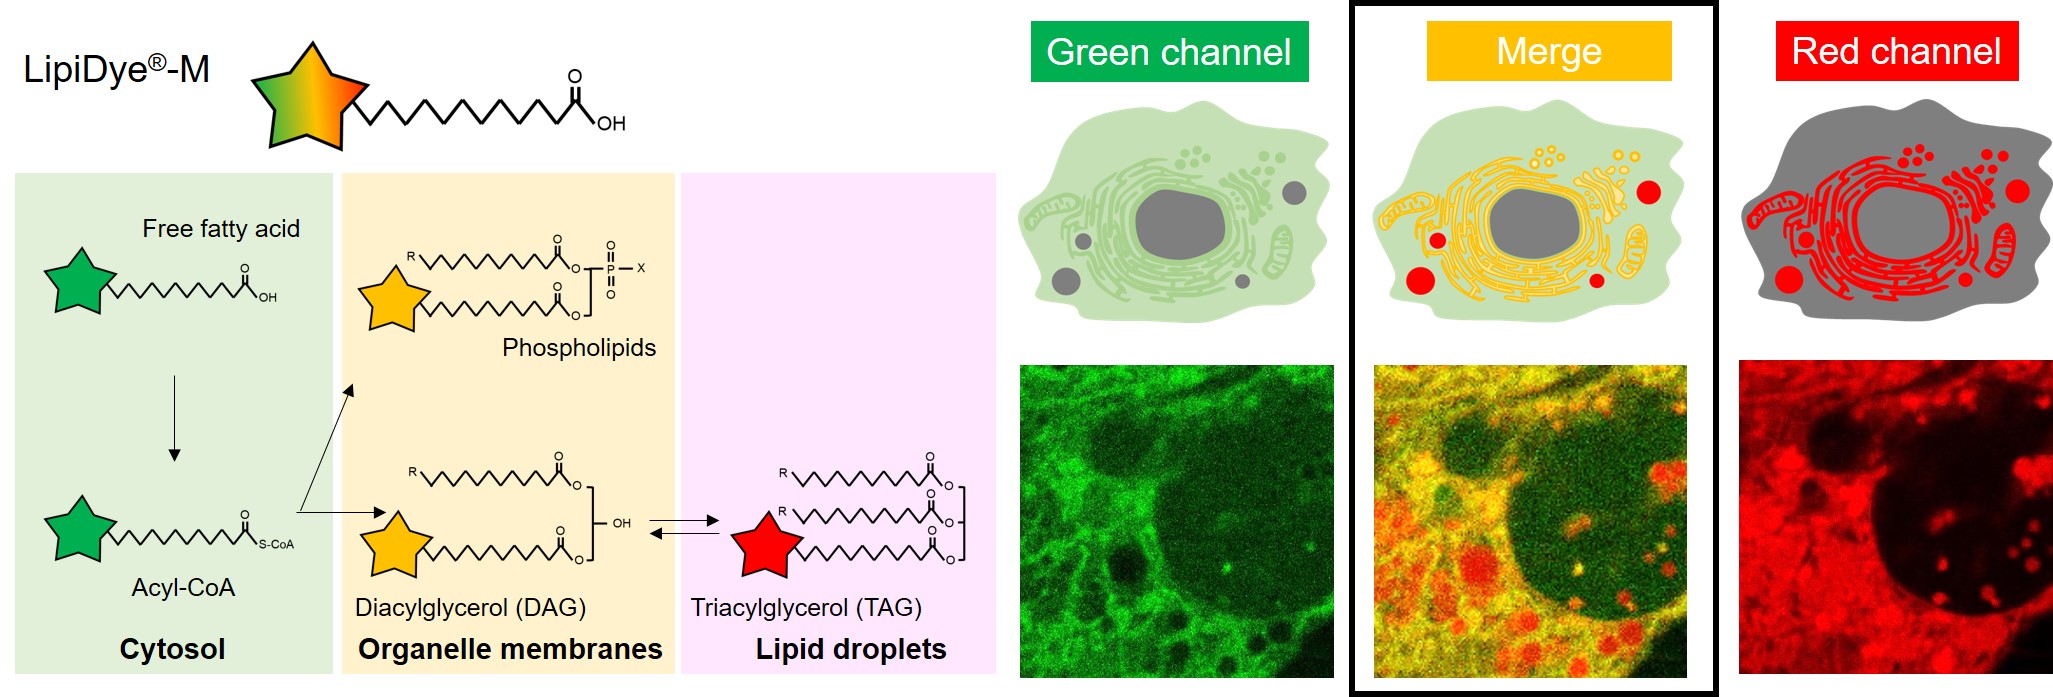
LipiDye™-M is a solvatochromic dye-labeled fatty acid. After it is internalized through fatty acid transporters, it undergoes lipid metabolism in the cell, and its fluorescence changes as its localization changes. Green-fluorescence and red-fluorescence pictures are obtained by imaging, and by superimposing them, the state of lipid metabolism can be distinguished by three colors.
Fatty Acid Metabolism and LipiDye™-M
Fatty acids (FAs) are the smallest units of lipids and are converted into various lipid structures in cells, including acyl-CoA, phospholipids, glycolipids, diacylglycerol (DAG), and triacylglycerol (TAG). Fatty acid metabolism involves a large number of enzymes and is tightly regulated, and failure of these enzymes is thought to lead to disease states. In order to understand lipid metabolism, a tool to analyze the metabolic processes of fatty acids is required, and fluorescently labeled fatty acids are widely used. However, it has been difficult to separate and analyze the metabolic processes of fatty acids because their fluorescence characteristics rarely change regardless of the metabolic process.
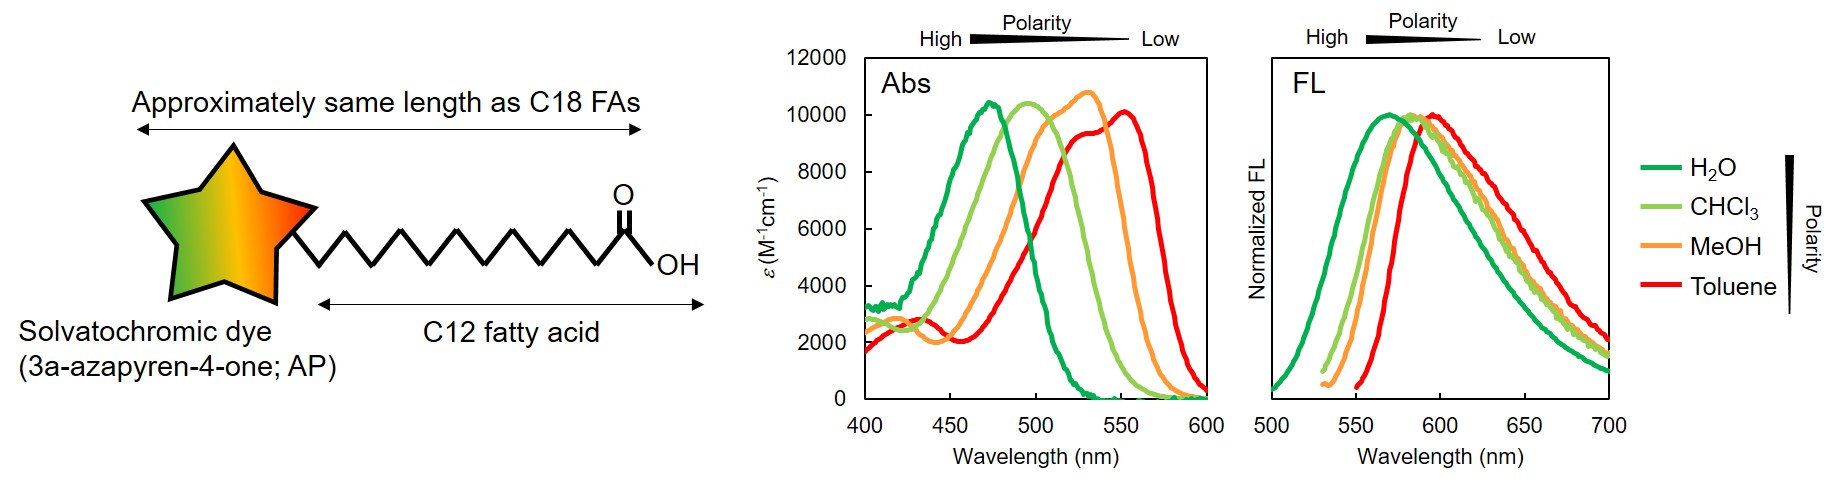
LipiDye™-M is a novel fluorescently labeled fatty acid (AP-C12 in original paper) developed to overcome the above problems. A novel environment-responsive fluorescent dye, azapyrene, is added to a 12 carbon fatty acid, and when the fluorescent group is included, it is approximately equivalent in size to a C18 fatty acid (Fig. 1, left). Unlike conventional fluorescent dyes, azapyrene recognizes the polarity of surrounding molecules and changes both the absorption and fluorescence wavelengths. In a high-polarity environment (hydrophilic), it is green, and in a low-polarity environment (hydrophobic), it shifts to red. By selecting an appropriate excitation light source and detection wavelength, the state of lipid metabolism in each environment can be observed separately.
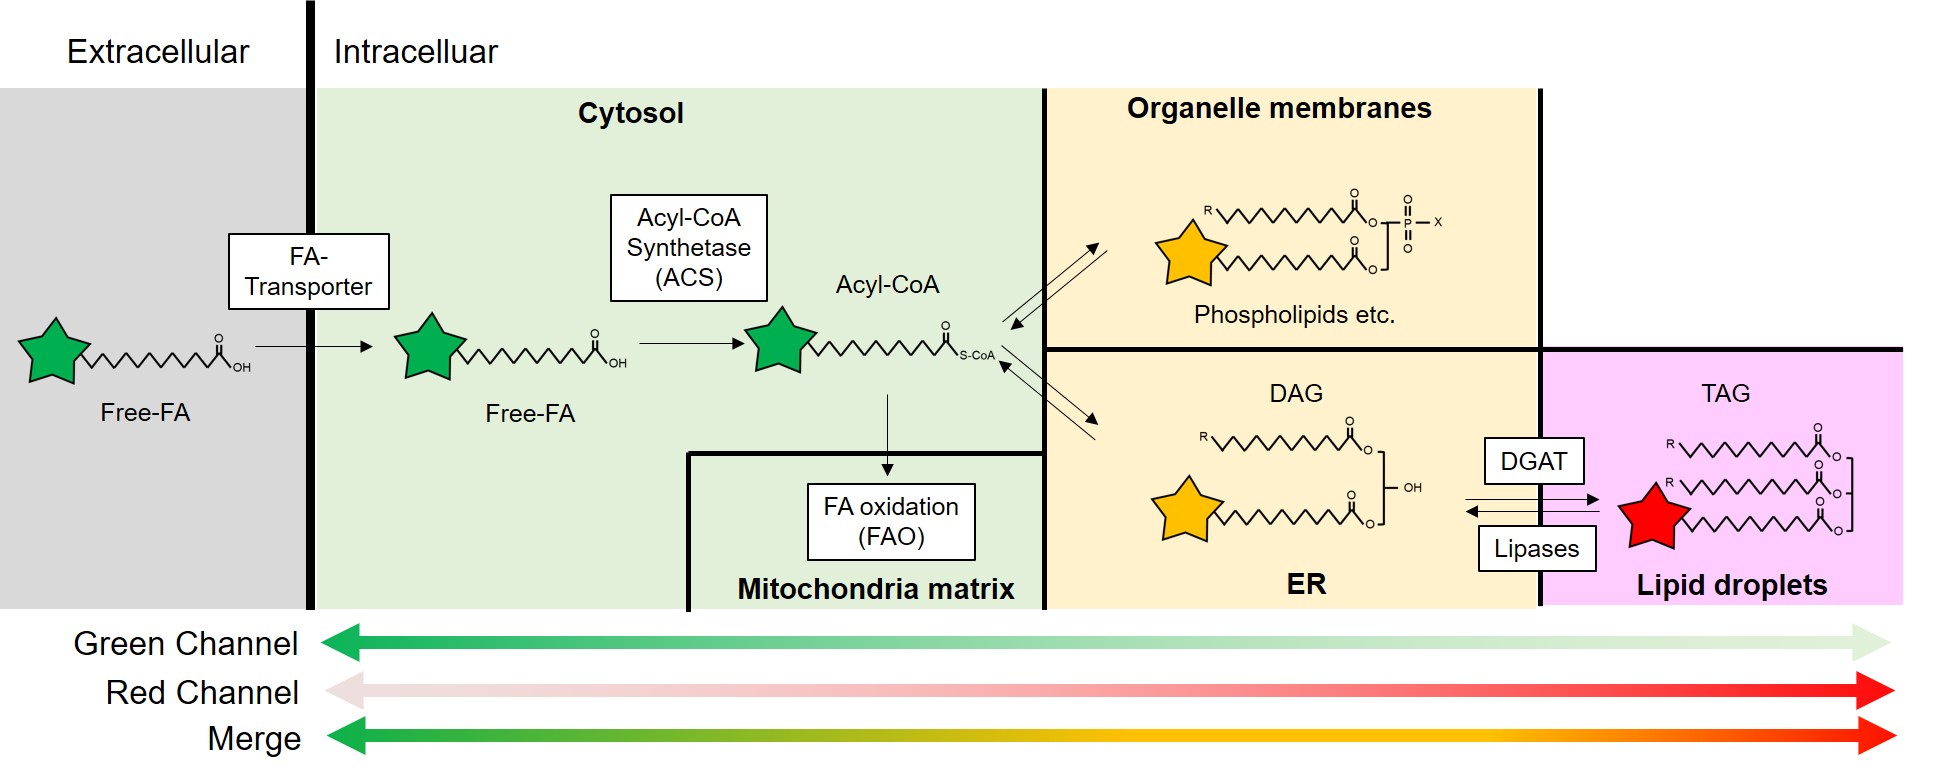
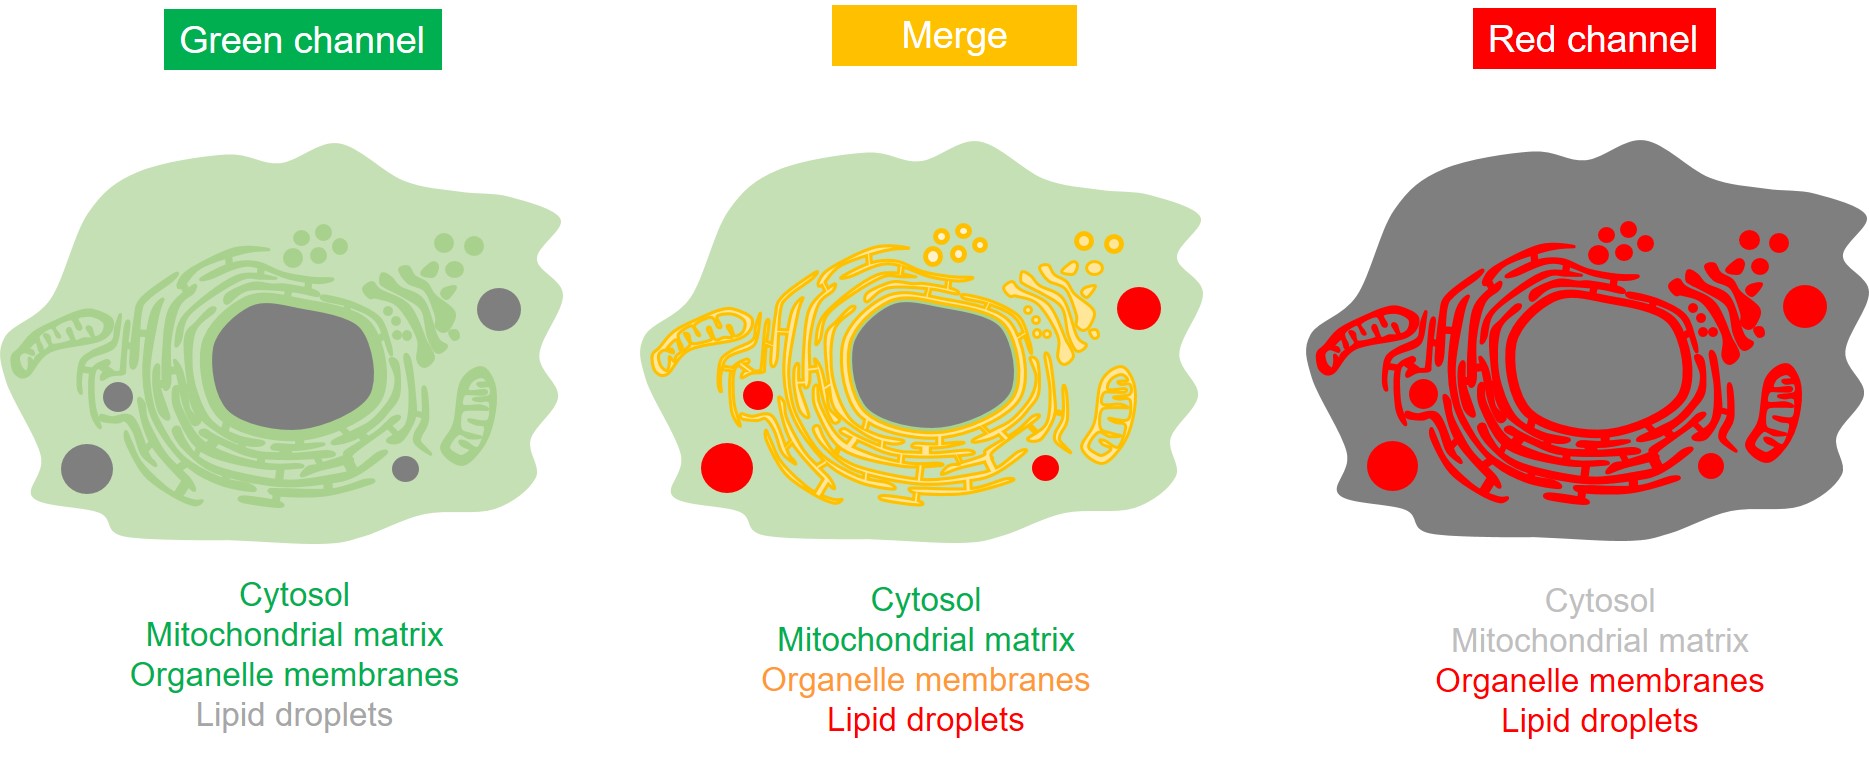
Because of the above properties, after LipiDye™-M is taken into the cell via fatty acid transporters, it undergoes lipid metabolism in the cell and is converted into various lipid structures. Each lipid is transferred to an appropriate location, and as shown in Fig. 2, the fluorescence color changes according to the polarity of each organelle. After treatment of living cells with LipiDye™-M, green (Ex. 450-490 nm / Em. 490-540 nm) and red (Ex. 550-600 nm / Em. 570-620 nm) fluorescence are obtained by fluorescence microscopy, and by superimposing them, the state of lipid metabolism can be visualized in three colors as shown in Fig. 3. In the superimposed images, the cytoplasm (Free fatty acids, acyl-CoA) and mitochondrial lumen (fatty acid β-oxidation metabolites) are mainly observed in green, the organelle membranes (Phospholipids, DAG, etc.) in yellow, and lipid droplets (TAG) in red. Further quantitative analysis is possible by performing ratio analysis of green and red fluorescence images. For quantitative analysis by ratio analysis, refer to ☞ the original paper.
Feature
- LipiDye™-M exhibits green-to-red fluorescence depending on its lipid structure and its localization.
- LipiDye™-M can visualize status of fatty acid metabolism by confocal fluorescent microscopy.
- Likely to native fatty acids, LipiDye™-M can also be taken up to cells by FA-transporters and converted into many types of lipids, including acyl-CoA, phospholipids, DAGs, TAGs, and degraded to small metabolites by the mitochondrial FAO pathway.
- LipiDye™-M emits green fluorescence in high polarity (cytosol), yellow fluorescence in moderate polarity (organelle membranes) and red fluorescence in low polarity (lipid droplets).
- LipiDye™-M allows to perform three-color imaging (green, yellow and red) by merging images from a green channel (Ex. 450-490 nm / Em. 490-540 nm) and red channel (Ex. 550-600 nm / Em. 570-620 nm).
Fluorescent property and recommended condition
In order to properly observe the difference in environmental response of LipiDye™-M, it is necessary to carefully consider the excitation wavelength and fluorescence wavelength. Confocal microscope is recommended. Please consider the excitation light and detection filter with reference to the spectrum below.
| Detection channel | Excitation wavelength | Recommended excitation wavelength |
Detection wavelength |
|---|---|---|---|
| Green fluorescence channel | 450-490 nm | 457, 473 nm laser* | 490-540 nm |
| Red fluorescence channel | 550-600 nm | 559 nm laser | 570-620 nm |
| * 488 nm excitation may cause weak fluorescence. | |||
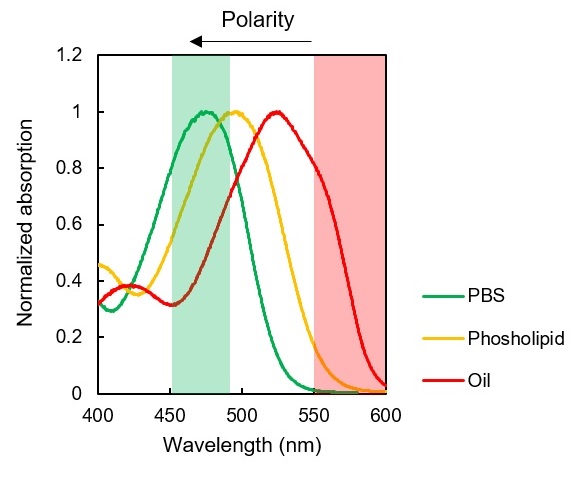
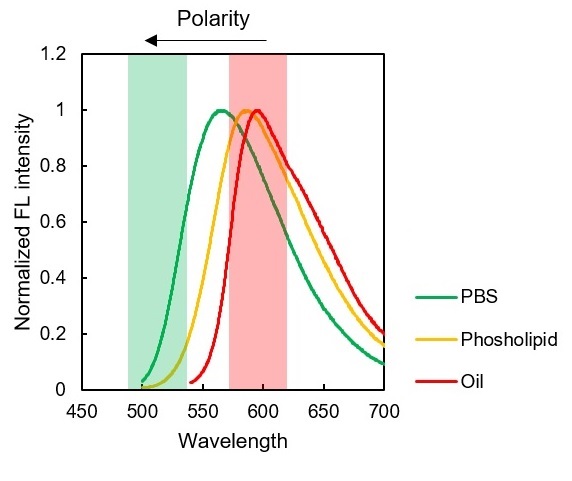
excitation/fluorescence spectrum of LipiDye™-M in PBS, phospholipid Liposomes, and soybean oil
Application data
Uptake in adipocytes Uptake in HepG2 cells Changes in lipid metabolism by drug treatment Effect of lipid degradation pathway inhibitors Cytotoxicity
Distribution of LipiDye™-M metabolites in live adipocytes
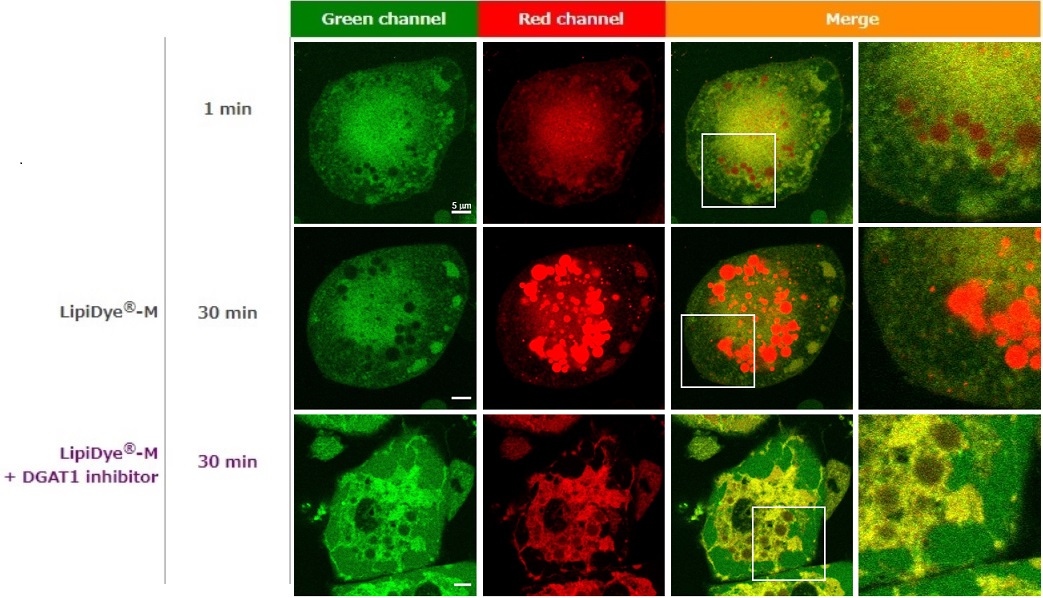
Adipocytes derived from 3T3-L1 cells were treated with LipiDye™-M (5 µM) and observed after 1 min or 30 min with confocal fluorescent microscopy without a wash step. Confocal images were recorded in the green channel (Ex. 473 nm/Em. 490-540 nm) and red channel (Ex. 559 nm/Em 570-620 nm). The images captured at 1 min shows strong green fluorescence intensity from cytosol and organelle membrane and weak red intensity from lipid droplets. This indicates major metabolites of LipiDye™-M are free-FA, and acyl-CoA and LipiDye™-M are insufficient to incorporate into TAGs. After 30 min, the intensity of the green channel decreased, and the red fluorescent signal from lipid droplets clearly increased. These images suggest LipiDye™-M was sufficiently converted into TAG lipids and accumulated into lipid droplets. Under treatment with a DGAT inhibitor to block TAG synthesis, a slight red signal is detected from lipid droplets, and the yellow signal of organelle membranes on the merged image dramatically increased. This result indicates DGAT inhibitor blocks TAG biosynthesis on ER membrane, and metabolites of LipiDye™-M were highly accumulated in organelle membranes as DAG species.
Distribution of LipiDye™-M metabolites in live HepG2
Observation of subcellular localization of LipiDye™-M by confocal laser microscopy
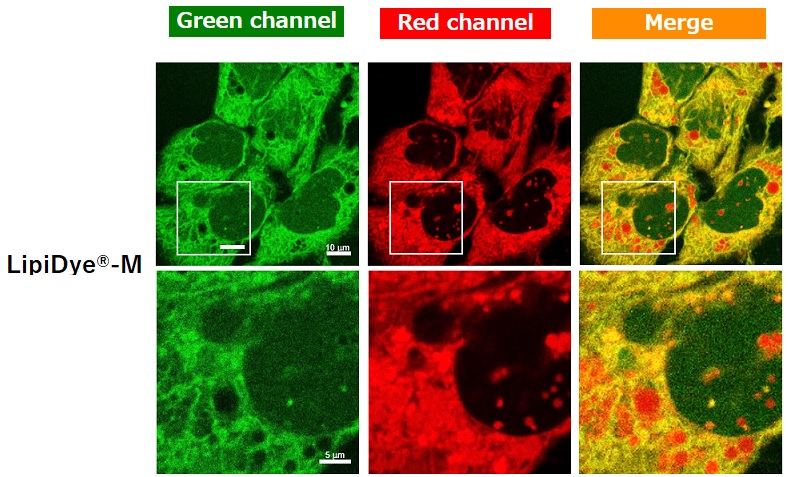
HepG2 cells were treated with oleic acid/palmitic acid in a complete medium containing 10% FBS to mature lipid droplets. Afterward, the culture media was exchanged with HBSS containing LipiDye™-M (5 µM), the cells were incubated for 1 hour and observed by confocal fluorescent microscopy without a wash step. Confocal images were recorded in the green channel (Ex. 473 nm/Em 490-540 nm) and red channel (Ex. 559 nm/Em 570-620 nm). Under serum-starved conditions, the merged image showed LipiDye™-M effectively incorporated into the cells, and its metabolites were distributed in not only the cytosol (green), ER (yellow), and lipid droplets (red) but also mitochondria as yellow.
Intracellular metabolic transformation of LipiDye™-M by TLC
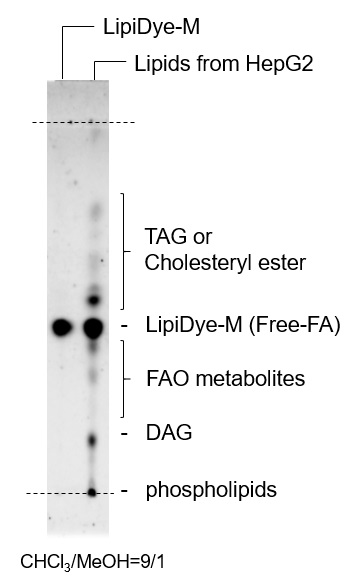
Effect of FA metabolism inhibitors on the distribution of LipiDye™-M metabolites
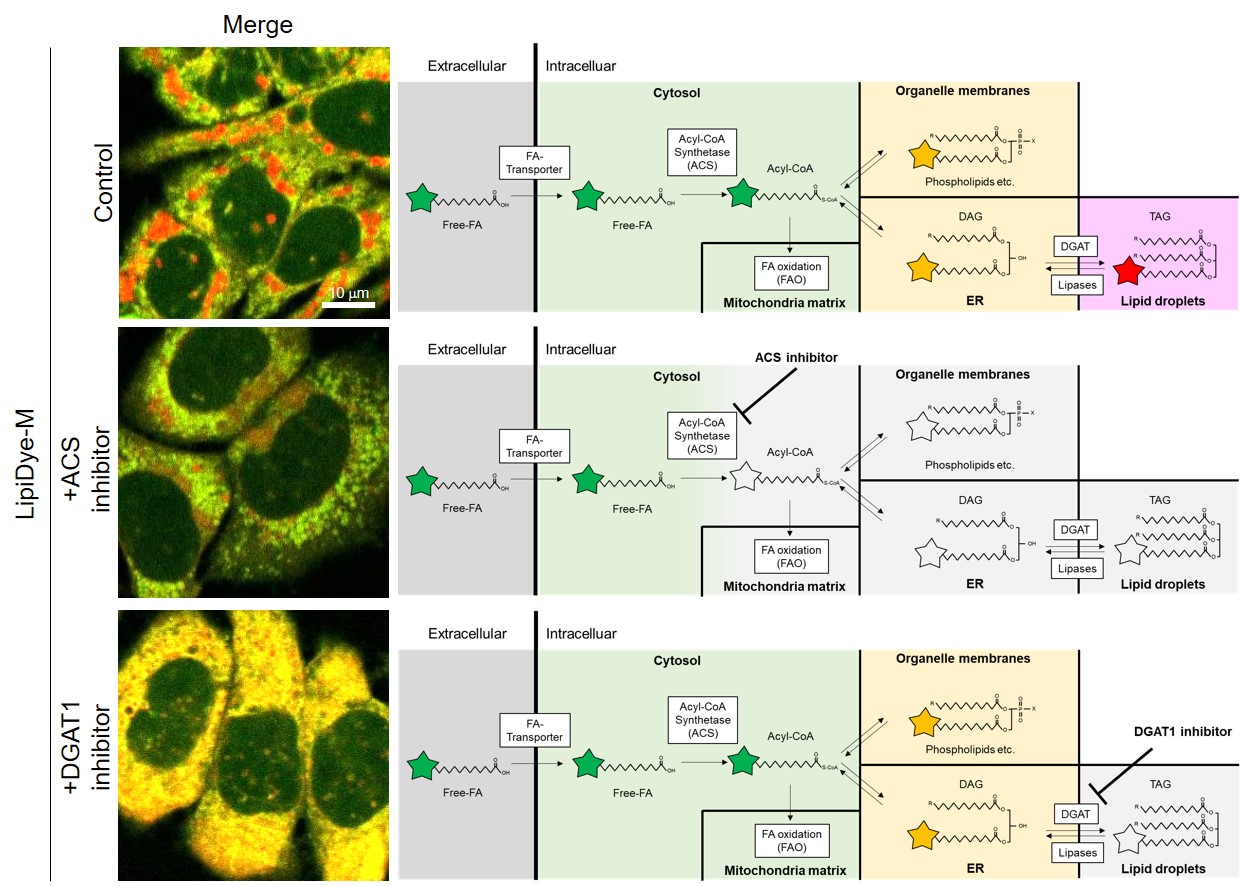
HepG2 cells were treated with FA metabolism inhibitors, acyl-CoA synthase (ACS) inhibitor (Triacsin C, 5 µM) or DGAT1 inhibitor (T863, 20 µM), in complete medium for 18 hours. Afterward, the media was replaced with HBSS containing 5 µM LipiDye™-M, 0.5 mM oleic acid, and the indicated inhibitor. The cells were incubated for 6 hours and observed. Confocal images were recorded in the green channel (Ex. 473 nm/Em 490-540 nm) and the red channel (Ex. 559 nm/Em 570-620 nm). Merged images are shown below on the left, and proposed metabolic pathways under treatment of each inhibitor are shown on the right. In the control cell, strong red signals from lipid droplets were observed. Under treatment with ACS inhibitor, both red and yellow signals dramatically decreased, and green signals increased. This result indicates ACS inhibitor suppresses the conversion of free-FA to acyl-CoA, and the free-FA form of LipiDye™-M is accumulated in the cytosol and organelles. Under treatment of DGAT inhibitor, yellow signals clearly increased, while a little red signal from lipid droplet was observed. This data shows DGAT1 inhibitor blocked the conversion of DAG to TAG, and excess DAG was accumulated in the ER.
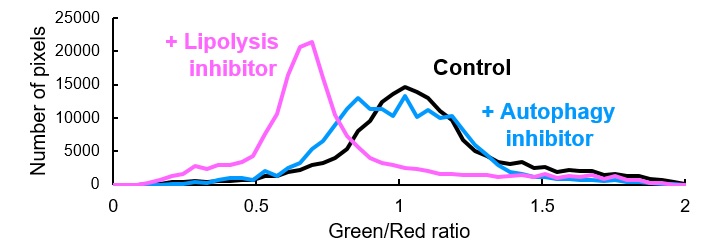
Effects of lipid degradation pathway inhibitors
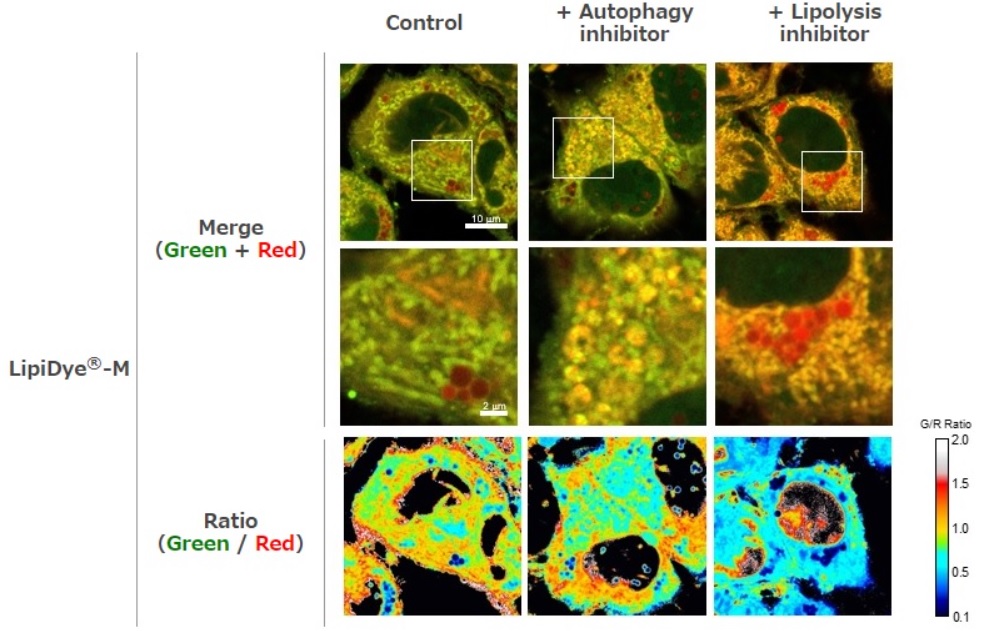
HepG2 cells were cultured in HBSS containing LipiDye™-M (5 µM) and autophagy inhibitor (50 nM Bafilomycin A1) or lipolysis (100 µM DEUP) for 6 hours. Afterward, confocal images were recorded in the green channel (Ex. 473 nm/Em 490-540 nm) and red channel (Ex. 559 nm/Em 570-620 nm). Both images merged (Green + Red; left), and ratio images (Green/Red; right) were calculated. In the control condition, mitochondria (green) and lipid droplets (red) were mainly observed in the merged image. Under the treatment of autophagy inhibitor, vesicle-structure indicating autophagosomes were detected by yellow color in the merged image. This data indicates lipid degradation by lipophagy was suppressed by the autophagy inhibitor.
* Detailed information about the ratiometric analysis is described in ☞ the original paper.
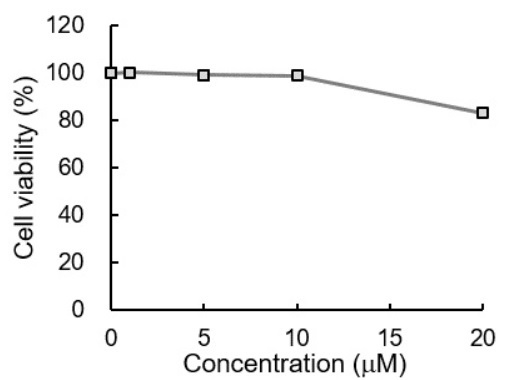
Cytotoxicity
Original Paper
Kajiwara, K., et al., "A negative-solvatochromic fluorescent probe for visualizing intracellular distributions of fatty acid metabolites.", Nat. Commun., 13(1), 2533 (2022). [PMID:35534485]
Product information
[Date : July 31 2026 00:08]
| Detail | Product Name | Product Code | Supplier | Size | Price | ||||||||||||||||||||||||||||||
|---|---|---|---|---|---|---|---|---|---|---|---|---|---|---|---|---|---|---|---|---|---|---|---|---|---|---|---|---|---|---|---|---|---|---|---|
|
LipiDye-M <Lipid Metabolism Tracer> DatasheetThis may not be the latest data sheet. |
FDV-0028 | FNAFunakoshi Co.,Ltd. | 0.1 mg | $600 | |||||||||||||||||||||||||||||||
|
|
|
||||||||||||||||||||||||||||||||||
[Date : July 31 2026 00:08]
LipiDye-M <Lipid Metabolism Tracer>
DatasheetThis may not be the latest data sheet.
- Product Code: FDV-0028
- Supplier: FNA
- Size: 0.1mg
- Price: $600
| Description |
LipiDye™-M is a fatty acid labeled with a novel solvatochromic dye. As LipiDye™-M exhibits green-to-red fluorescence depending on its lipid structure and its localization, LipiDye™-M can trace status of cellular fatty acid uptake and lipid metabolism in cells. |
||
|---|---|---|---|
| Storage | -20°C | CAS | |
| Link | |||
You may also like
-25-metabolism_map.jpg)
CONTACT
export@funakoshi.co.jp
- ※Prices on our website are for your reference only. Please inquire your distributor for your prices.
- ※Please note that Product Information or Price may change without notice.