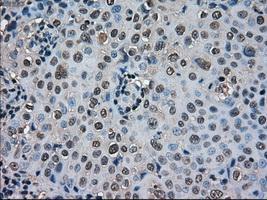
GTX83592 IHC-P Image
Immunohistochemical staining of paraffin-embedded Adenocarcinoma of breast tissue using anti-SOD1 mouse monoclonal antibody. (GTX83592, Dilution 1:50)
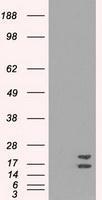
GTX83592 WB Image
HEK293T cells were transfected with the pCMV6-ENTRY control (Left lane) or pCMV6-ENTRY SOD1 (Right lane) cDNA for 48 hrs and lysed. Equivalent amounts of cell lysates (5 ug per lane) were separated by SDS-PAGE and immunoblotted with anti-SOD1.
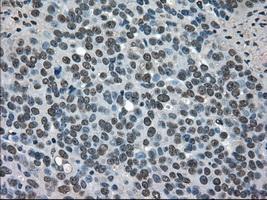
GTX83592 IHC-P Image
Immunohistochemical staining of paraffin-embedded Adenocarcinoma of ovary tissue using anti-SOD1mouse monoclonal antibody. (GTX83592, Dilution 1:50)
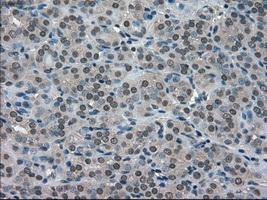
GTX83592 IHC-P Image
Immunohistochemical staining of paraffin-embedded Carcinoma of thyroid tissue using anti-SOD1mouse monoclonal antibody. (GTX83592, Dilution 1:50)
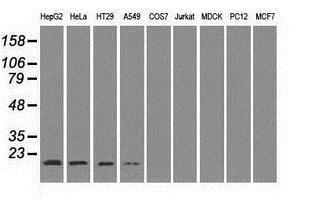
GTX83592 WB Image
Western blot analysis of extracts (35ug) from 9 different cell lines by using anti-SOD1 monoclonal antibody.
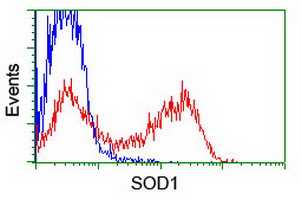
GTX83592 FACS Image
HEK293T cells transfected with either SOD1 overexpress plasmid (Red) or empty vector control plasmid (Blue) were immunostained by anti-SOD1 antibody (GTX83592), and then analyzed by flow cytometry.