GTX83012 FACS Image
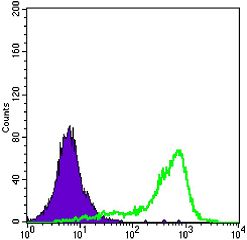
FACS analysis of A431 cells using GTX83012 SOD1 antibody [6F5].
Green : SOD1
Purple : negative control
GTX83012 ICC/IF Image
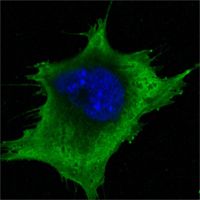
ICC/IF analysis of 3T3-L1 cells using GTX83012 SOD1 antibody [6F5].
Green : SOD1
Blue: DRAQ5 fluorescent DNA dye
GTX83012 ICC/IF Image
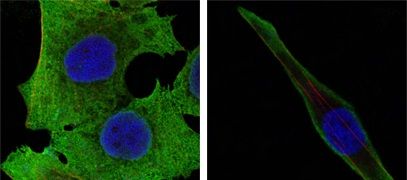
ICC/IF analysis of PANC-1 (left) and SKBR-3 (right) cells using GTX83012 SOD1 antibody [6F5].
Green : SOD1
Blue: DRAQ5 fluorescent DNA dye
Red: Actin filaments
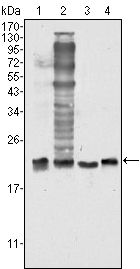
GTX83012 WB Image
WB analysis of HeLa (1), NIH3T3 (2), A549 (3) and A431 (4) cell lysate using GTX83012 SOD1 antibody [6F5].