GTX80551 FACS Image
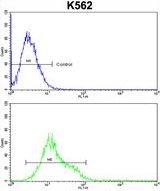
FACS analysis of K562 cells using GTX80551 ULK1 antibody.
Top histogram : negative control
Bottom histogram : K562 cells
GTX80551 WB Image
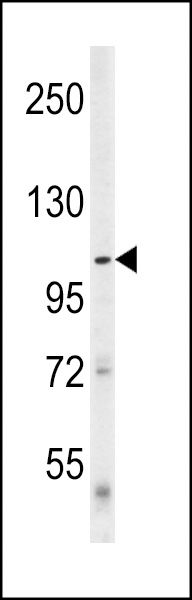
WB analysis of mouse cerebellum tissue lysate (35ug/lane) using GTX80551 ULK1 antibody.
GTX80551 IHC-P Image
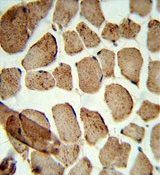
IHC-P analysis of human skeletal muscle using GTX80551 ULK1 antibody.