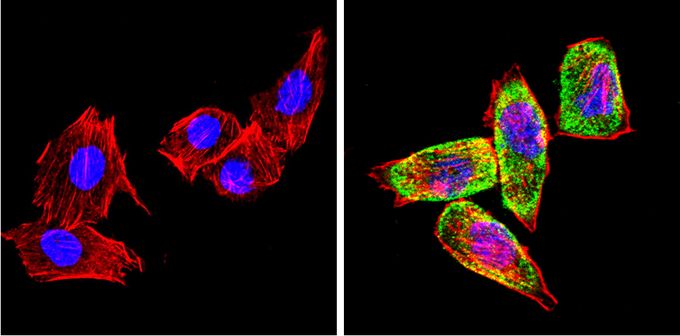
GTX79174 ICC/IF Image
ICC/IF analysis of H-4-II-E cells with (right) or without (left) Cytochrome P450 2C11 antibody at a dilution of 1:100 (green). F-actin (red) was stained with a flourescent red phalloidin and nuclei (blue) were stained with DAPI. Images were taken at a magnification of 60x.
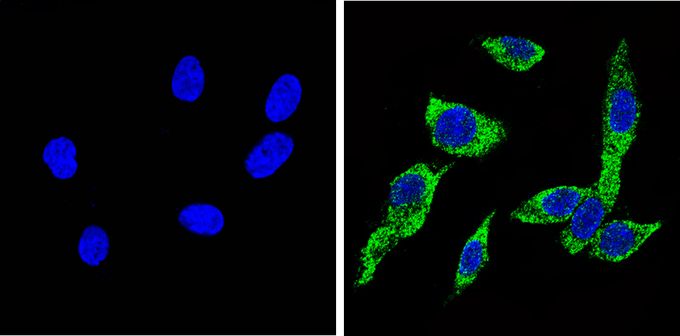
GTX79174 ICC/IF Image
ICC/IF analysis of PC12 cells with (right) or without (left) Cytochrome P450 2C11 antibody at a dilution of 1:100 (green). Nuclei (blue) were stained with DAPI. Images were taken at a magnification of 60x.
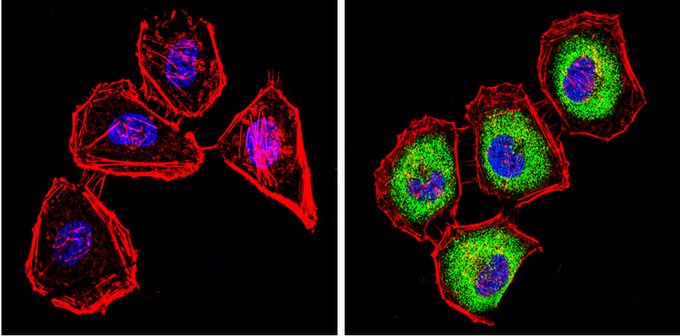
GTX79174 ICC/IF Image
ICC/IF analysis of HeLa cells with (right) or without (left) Cytochrome P450 2C11 antibody at a dilution of 1:100 (green). F-actin (red) was stained with a flourescent red phalloidin and nuclei (blue) were stained with DAPI. Images were taken at a magnification of 60x.
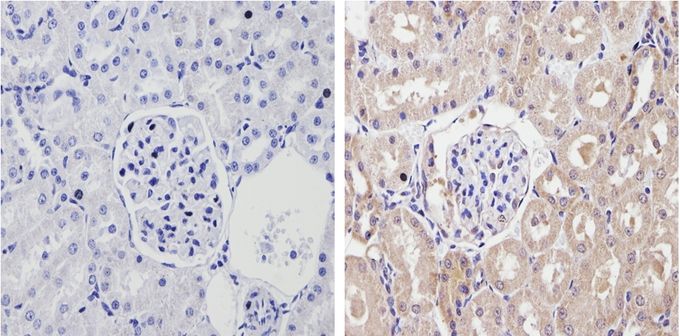
GTX79174 IHC-P Image
IHC-P analysis of rat kidney tissue with (right) or without (left) Cytochrome P450 2C11 antibody at a dilution of 1:200. To expose target proteins, antigen retrieval method was performed using 10mM sodium citrate (pH 6.0) microwaved for 8-15 min.
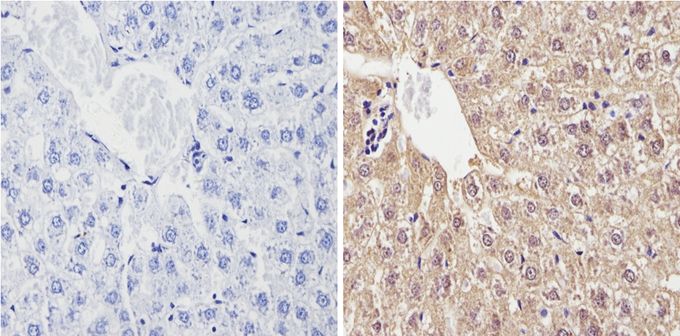
GTX79174 IHC-P Image
IHC-P analysis of rat liver tissue with (right) or without (left) Cytochrome P450 2C11 antibody at a dilution of 1:200. To expose target proteins, antigen retrieval method was performed using 10mM sodium citrate (pH 6.0) microwaved for 8-15 min.