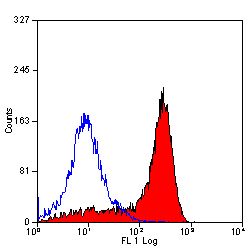
GTX76060 FACS Image
FACS analysis of rat peritoneal macrophages using GTX76060 CD11b antibody [OX-42].
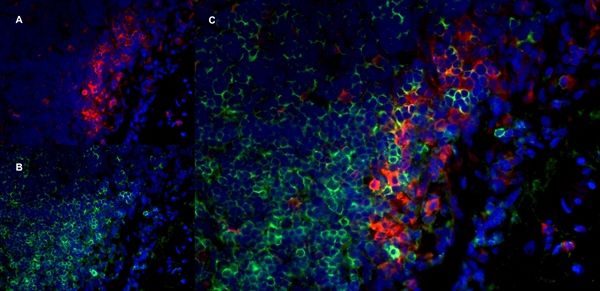
GTX76060 IHC-Fr Image
IHC-Fr staining of rat lymph node with Mouse anti Rat CD11b antibody (GTX76060), red in A and Mouse anti Rat CD8 (GTX41831), green in B. C is the merged image with nuclei counter-stained in blue using DAPI. High power
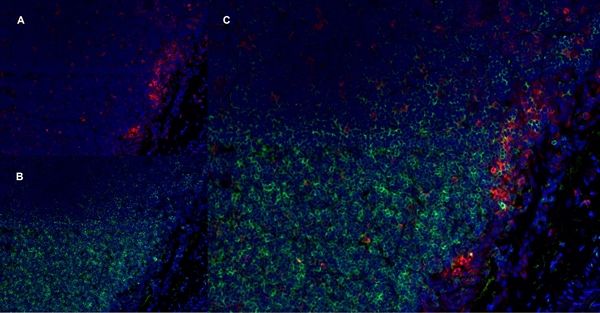
GTX76060 IHC-Fr Image
IHC-Fr staining of rat lymph node with Mouse anti Rat CD11b antibody (GTX76060), red in A and Mouse anti Rat CD8 (GTX41831), green in B. C is the merged image with nuclei counter-stained in blue using DAPI. Low power
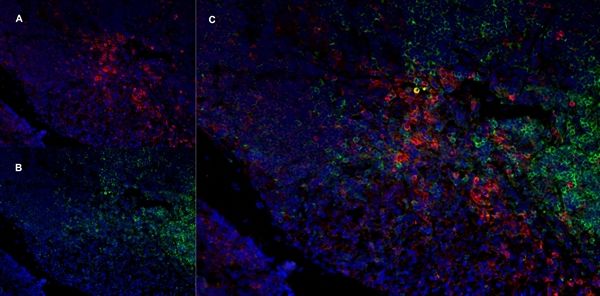
GTX76060 IHC-Fr Image
IHC-Fr staining of rat lymph node with Mouse anti Rat CD11b antibody (GTX76060), red in A and Mouse anti Rat CD8 (GTX41831), green in B. C is the merged image with nuclei counter-stained in blue using DAPI. Medium power
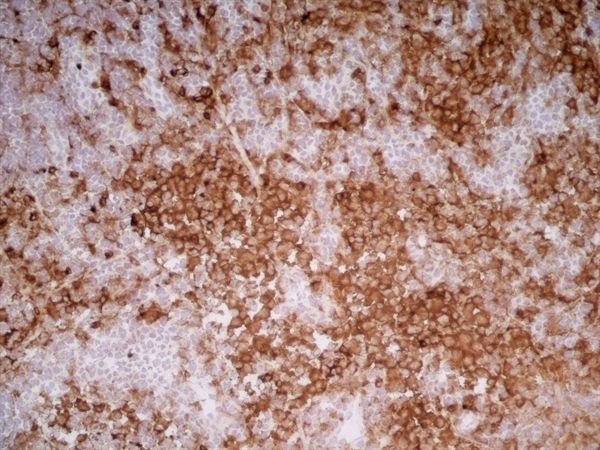
GTX76060 IHC-Fr Image
IHC-Fr analysis of rat lymph node tissue using GTX76060 CD11b antibody [OX-42].
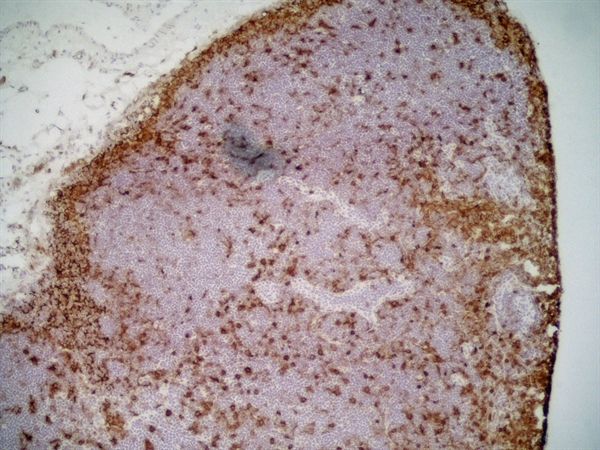
GTX76060 IHC-Fr Image
IHC-Fr analysis of rat lymph node tissue using GTX76060 CD11b antibody [OX-42].
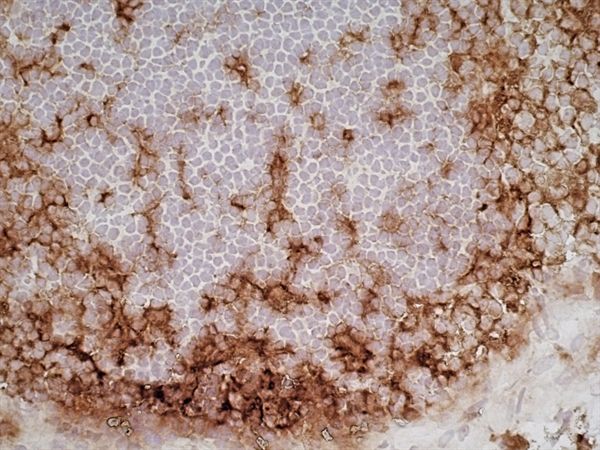
GTX76060 IHC-Fr Image
IHC-Fr analysis of rat lymph node tissue using GTX76060 CD11b antibody [OX-42].