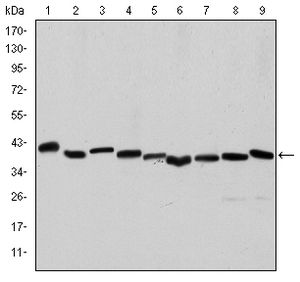
GTX60466 WB Image
WB analysis of HeLa (1), A431 (2), Jurkat (3), K562 (4), HEK293 (5), HepG2 (6), NIH3T3 (7), PC-12 (8) and Cos7 (9) cell lysate using GTX60466 alpha Smooth Muscle Actin antibody [4A4].
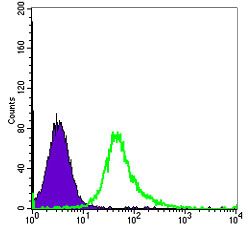
GTX60466 FACS Image
FACS analysis of HeLa cells using GTX60466 alpha Smooth Muscle Actin antibody [4A4].
Green : alpha Smooth Muscle Actin
Purple : negative control
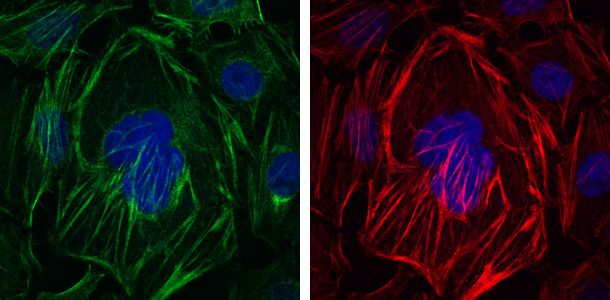
GTX60466 ICC/IF Image
ICC/IF analysis of HepG2 cells using GTX60466 alpha Smooth Muscle Actin antibody [4A4].
Green : alpha Smooth Muscle Actin
Blue: DRAQ5 fluorescent DNA dye
Red: Actin filaments
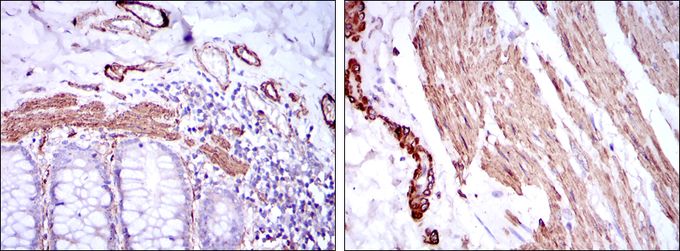
GTX60466 IHC-P Image
IHC-P analysis of human duodenum tissue (left) and human esophagus tissue (right) using GTX60466 alpha Smooth Muscle Actin antibody [4A4].
