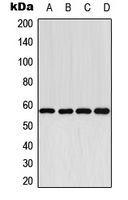
GTX56290 WB Image
Western blot analysis of Cytochrome P450 2E1 expression in HEK293T (A); NIH3T3 (B); H9C2 (C); Human Liver (D) whole cell lysates.
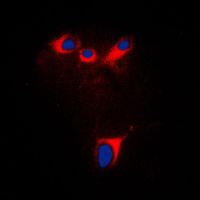
GTX56290 ICC/IF Image
Immunofluorescent analysis of Cytochrome P450 2E1 staining in NIH3T3 cells. Formalin-fixed cells were permeabilized with 0.1% Triton X-100 in TBS for 5-10 minutes and blocked with 3% BSA-PBS for 30 minutes at room temperature. Cells were probed with the primary antibody in 3% BSA-PBS and incubated overnight at 4 C in a humidified chamber. Cells were washed with PBST and incubated with a DyLight 594-conjugated secondary antibody (red) in PBS at room temperature in the dark. DAPI was used to stain the cell nuclei (blue).