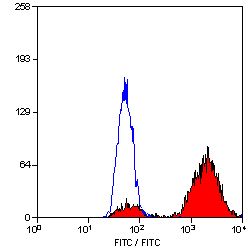
GTX41865 FACS Image
FACS analysis of mouse peritoneal macrophages using GTX41865 CD68 antibody [FA-11].
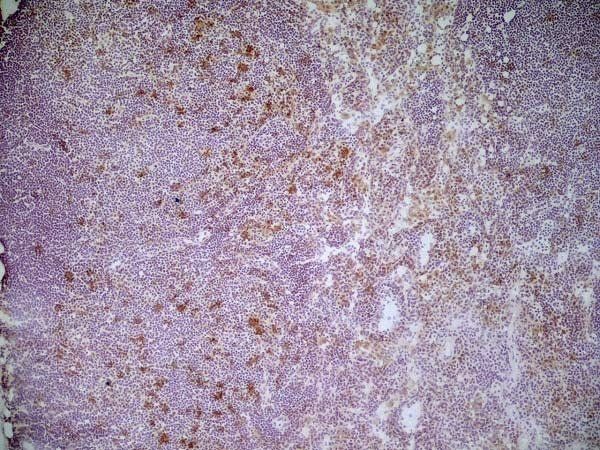
GTX41865 IHC-Fr Image
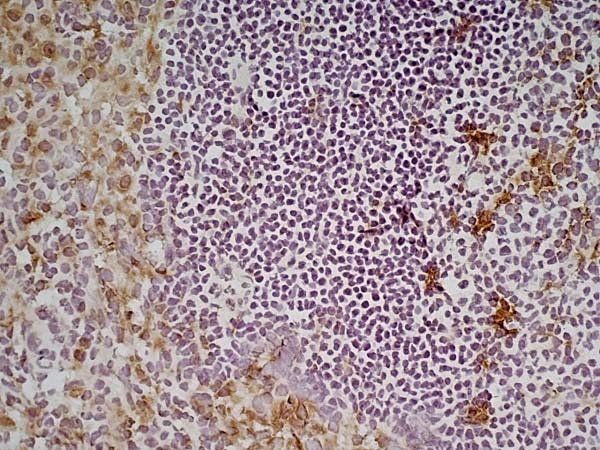
IHC-Fr analysis of mouse lymph node tissue using GTX41865 CD68 antibody at 1/100.
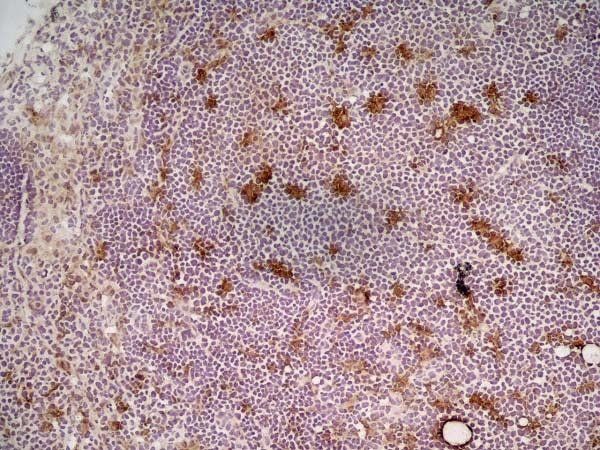
GTX41865 IHC-Fr Image
IHC-Fr analysis of mouse lymph node tissue using GTX41865 CD68 antibody at 1/100.
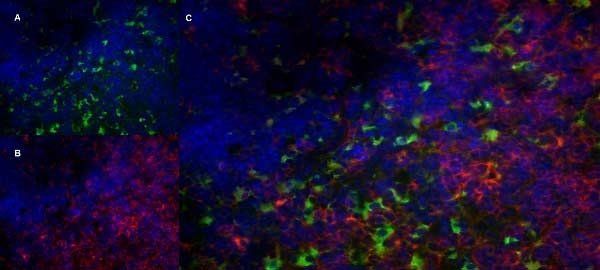
GTX41865 IHC-Fr Image
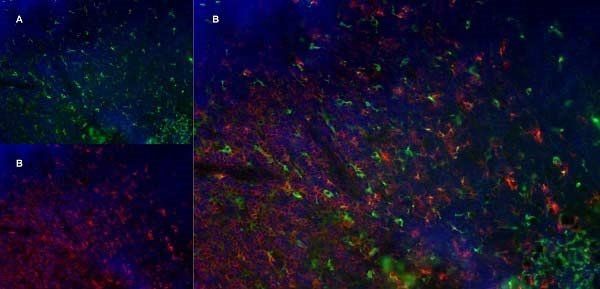
IHC-Fr analysis of a mouse lymph node with Rat anti Mouse CD68 antibody, clone FA11 (GTX41865), green in A and Rat anti Mouse CD8 antibody, clone YTS105.18 (GTX74642), red in B. C is the merged image with nuclei counterstained blue using DAPI. High power
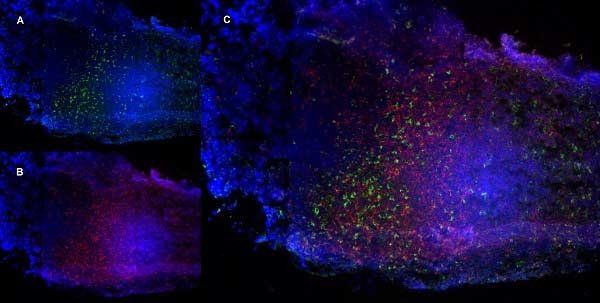
GTX41865 IHC-Fr Image
IHC-Fr analysis of a mouse lymph node with Rat anti Mouse CD68 antibody, clone FA11 (GTX41865), green in A and Rat anti Mouse CD8 antibody, clone YTS105.18 (GTX74642), red in B. C is the merged image with nuclei counterstained blue using DAPI. Low power
GTX41865 IHC-Fr Image
IHC-Fr analysis of a mouse lymph node with Rat anti Mouse CD68 antibody, clone FA11 (GTX41865), green in A and Rat anti Mouse CD8 antibody, clone YTS105.18 (GTX74642), red in B. C is the merged image with nuclei counterstained blue using DAPI. Medium power
GTX41865 IHC-Fr Image
IHC-Fr analysis of mouse lymph node tissue using GTX41865 CD68 antibody [FA-11].
GTX41865 IHC-Fr Image
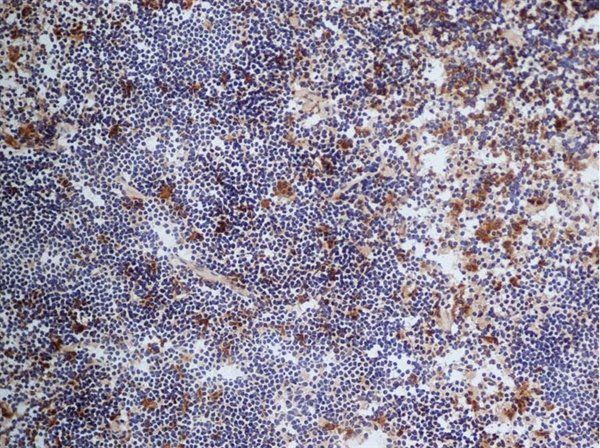
IHC-Fr analysis of mouse spleen tissue using GTX41865 CD68 antibody [FA-11] showing staining of macrophages in the red pulp
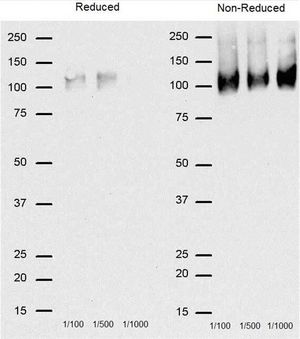
GTX41865 WB Image
WB analysis of J774 cell lysate using GTX41865 CD68 antibody [FA-11].