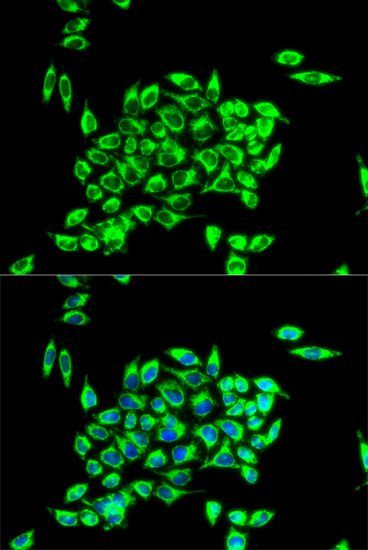
GTX33558 ICC/IF Image
ICC/IF analysis of HeLa cell using GTX33558 TRAP1 antibody.
Blue : DAPI
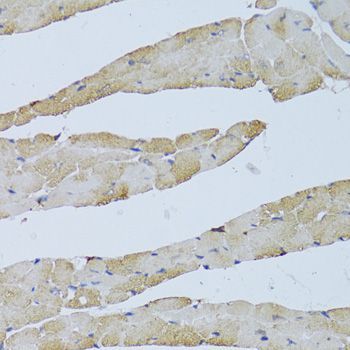
GTX33558 IHC-P Image
IHC-P analysis of mouse heart tissue using GTX33558 TRAP1 antibody.
Dilution : 1:100
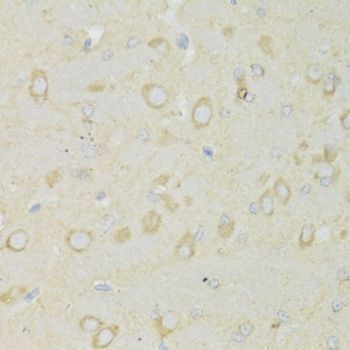
GTX33558 IHC-P Image
IHC-P analysis of rat brain tissue using GTX33558 TRAP1 antibody.
Dilution : 1:100
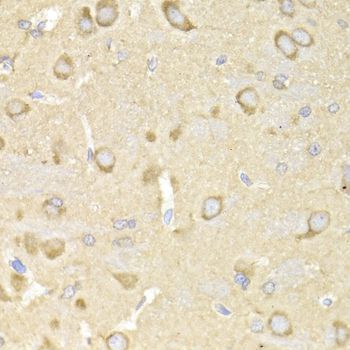
GTX33558 IHC-P Image
IHC-P analysis of rat brain tissue using GTX33558 TRAP1 antibody.
Dilution : 1:200
GTX33558 IHC-P Image
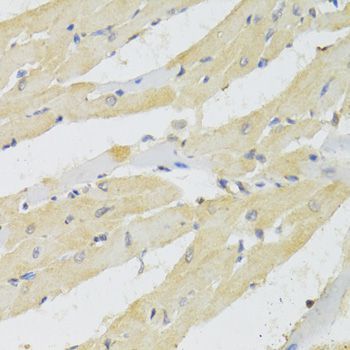
IHC-P analysis of rat heart tissue using GTX33558 TRAP1 antibody.
Dilution : 1:100
GTX33558 IHC-P Image
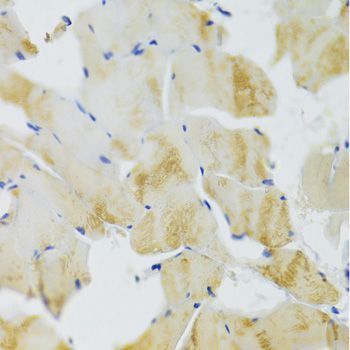
IHC-P analysis of rat skeletal muscle tissue using GTX33558 TRAP1 antibody.
Dilution : 1:100
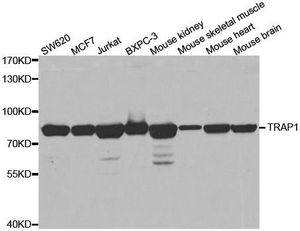
GTX33558 WB Image
WB analysis of various samples using GTX33558 TRAP1 antibody.
Dilution : 1:1000
Loading : 25ug per lane
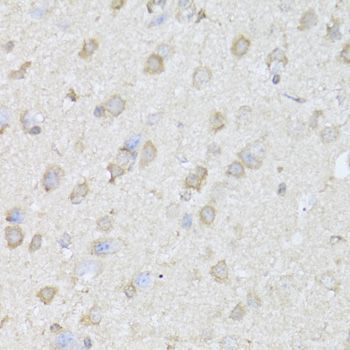
GTX33558 IHC-P Image
IHC-P analysis of mouse brain tissue using GTX33558 TRAP1 antibody.
Dilution : 1:100