GTX30123 FACS Image
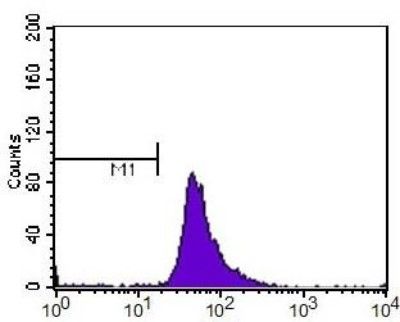
FACS analysis of HepG2 cells using GTX30123 HIF2 alpha antibody [ep190b]. M1 is defined by unstained cells.
Purple : primary antibody
Dilution : 1:400
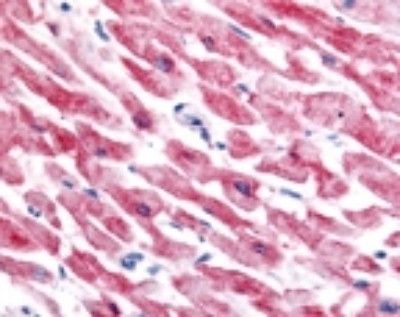
GTX30123 IHC-P Image
IHC-P analysis of human heart tissue using GTX30123 HIF2 alpha antibody [ep190b].
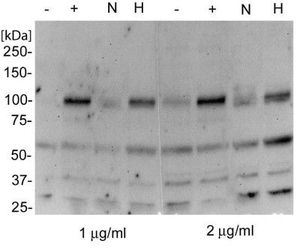
GTX30123 WB Image
WB analysis of multiple samples using GTX30123 HIF2 alpha antibody [ep190b].
Lane 1 and 5: HepG2 without Cobalt (II) Chloride
Lane 2 and 6: HepG2 with Cobalt (II) Chloride
Lane 3 and 7: HepG2 normoxic
Lane 4 and 8 : HepG2 hypoxic
Dilution : 1-2 ug/ml

GTX30123 WB Image
WB analysis of HeLa cell lysate using GTX30123 HIF2 alpha antibody [ep190b].
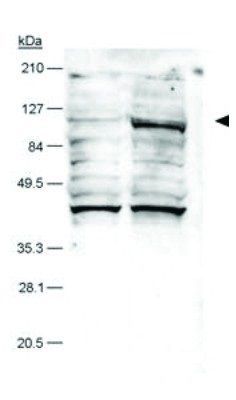
GTX30123 WB Image
WB analysis of hypoxia-treated A549 cell lysate using GTX30123 HIF2 alpha antibody [ep190b].
Lane 1: normoxic A549 lysate control
Lane 2: hypoxic A549 lysate