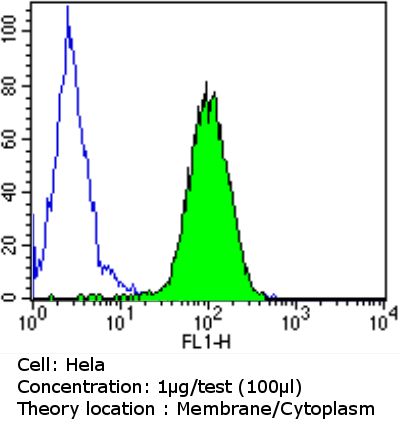
GTX22792 FACS Image
Flow cytometry analysis of PDI in HeLa cells compared to an isotype control (blue). Cells were harvested, adjusted to a concentration of 1-5x10^6 cells/ml, fixed with 2% paraformaldehyde and washed with PBS. Cells were blocked with a 2% solution of BSA-PBS for 30 min at room temperature and incubated with PDI antibody [RL90] at a dilution of 1 ug/test for 60 min at room temperature. Cells were then incubated for 40 min at room temperature in the dark using a proper secondary antibody and re-suspended in PBS for FACS analysis.
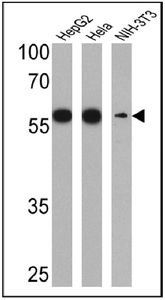
GTX22792 WB Image
Western blot analysis of PDI in 25 ug of HepG2, HeLa and NIH-3T3 cell lysates. Proteins were transferred to a PVDF membrane and blocked at 4üŗC overnight. The membrane was probed with PDI antibody [RL90] at a dilution of 1:1000 overnight at 4üŗC, washed in TBST, and probed with an HRP-conjugated secondary antibody. Chemiluminescent detection was performed.

GTX22792 ICC/IF Image
Immunofluorescent analysis of Phalloidin (blue) and PDI (green) in NIH 3T3 cells. Formalin fixed cells were permeabilized with 0.1% Triton X-100 in PBS for 10 minutes at room temperature and blocked with 2% BSA in PBS + 0.1% Triton X-100 for 30 minutes at room temperature. Cells were probed with PDI antibody [RL90] at a dilution of 1:75 for at least 1 hour at room temperature, washed with PBS, and incubated with a proper secondary antibody. Actin was stained with Dylight 350 Phalloidin and nuclei (red) were stained with DRAQ5. Images were taken at 20X magnification.