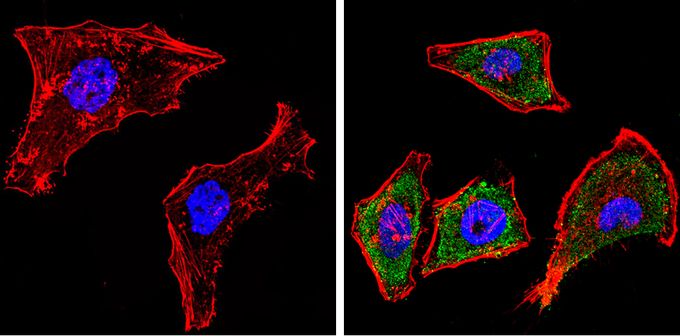
GTX15616 ICC/IF Image
Immunofluorescent analysis of Cytochrome P450 1A1/1A2 (green) in HeLa cells. Formalin-fixed cells were permeabilized with 0.1% Triton X-100 in TBS for 5-10 minutes and blocked with 3% BSA-PBS for 30 minutes at room temperature. Cells were probed with Cytochrome P450 1A1 + 1A2 antibody [MC1] in 3% BSA-PBS at a dilution of 1:100 and incubated overnight at 4üŗC in a humidified chamber. Cells were washed with PBST and incubated with a proper secondary antibody. F-actin (red) was stained with a flourescent red phalloidin and nuclei (blue) were stained with Hoechst or DAPI. Images were taken at a magnification of 60x.

GTX15616 IHC-P Image
Immunohistochemistry analysis of Cytochrome P450 1A1/1A2 in paraffin-embedded rat liver tissue (right) compared with a negative control without primary antibody (left). To expose target proteins, antigen retrieval was performed using 10mM sodium citrate (pH 6.0), microwaved for 8-15 min. Following antigen retrieval, tissues were blocked in 3% H2O2-methanol for 15 min at room temperature, washed with ddH2O and PBS, and then probed with Cytochrome P450 1A1 + 1A2 antibody [MC1] diluted by 3% BSA-PBS at a dilution of 1:100 overnight at 4üŗC in a humidified chamber. Tissues were washed extensively in PBST and detection was performed using an HRP-conjugated secondary antibody followed by colorimetric detection using a DAB kit. Tissues were counterstained with hematoxylin and dehydrated with ethanol and xylene to prep for mounting.