
GTX54106 ICC/IF Image
ICC/IF analysis of 293T cell using GTX54106 Histone H3K27me3 (tri-methyl Lys27) antibody.
Blue : DAPI
GTX54106 ICC/IF Image
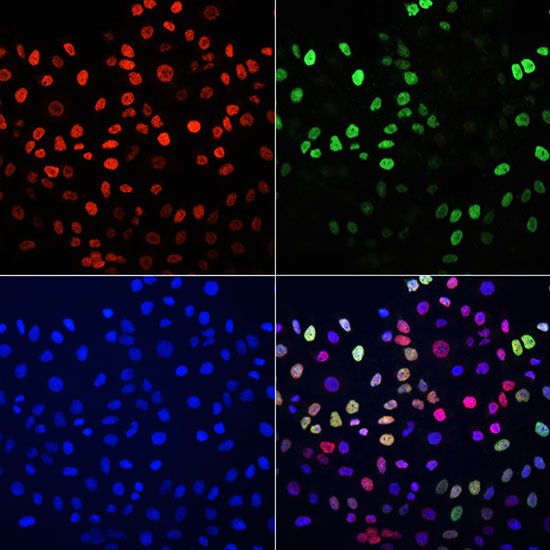
ICC/IF analysis of HeLa cell using GTX54106 Histone H3K27me3 (tri-methyl Lys27) antibody.
Red : Primary antibody
Green : BrdU antibody
Blue : DAPI

GTX54106 IHC-P Image
IHC-P analysis of human rectal cancer tissue using GTX54106 Histone H3K27me3 (tri-methyl Lys27) antibody.
Dilution : 1:200

GTX54106 IHC-P Image
IHC-P analysis of human thyroid cancer tissue using GTX54106 Histone H3K27me3 (tri-methyl Lys27) antibody.
Dilution : 1:200

GTX54106 IHC-P Image
IHC-P analysis of rat brain tissue using GTX54106 Histone H3K27me3 (tri-methyl Lys27) antibody.
Dilution : 1:200

GTX54106 IHC-P Image
IHC-P analysis of rat testis tissue using GTX54106 Histone H3K27me3 (tri-methyl Lys27) antibody.
Dilution : 1:200

GTX54106 WB Image
WB analysis of various samples using GTX54106 Histone H3K27me3 (tri-methyl Lys27) antibody.
Dilution : 1:1000
Loading : 25ug per lane

GTX54106 ChIP assay Image
ChIP analysis of 293T cells using GTX54106 Histone H3K27me3 (tri-methyl Lys27) antibody.The amount of immunoprecipitated DNA was checked by quantitative PCR. Histogram was constructed by the ratios of the immunoprecipitated DNA to the input.

GTX54106 Dot Image
Dot blot analysis of all sorts of methylation peptides using GTX54106 Histone H3K27me3 (tri-methyl Lys27) antibody.