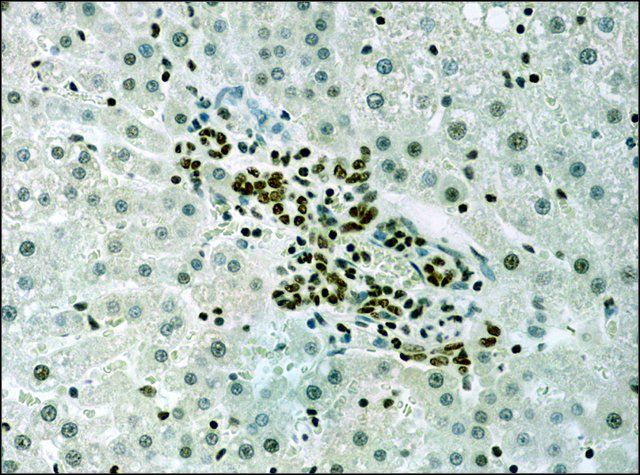
GTX12178 IHC-P Image
IHC-P analysis of rat liver tissue using GTX12178 Histone H3K9ac (acetyl Lys9) antibody at 0.1 ug/mL.
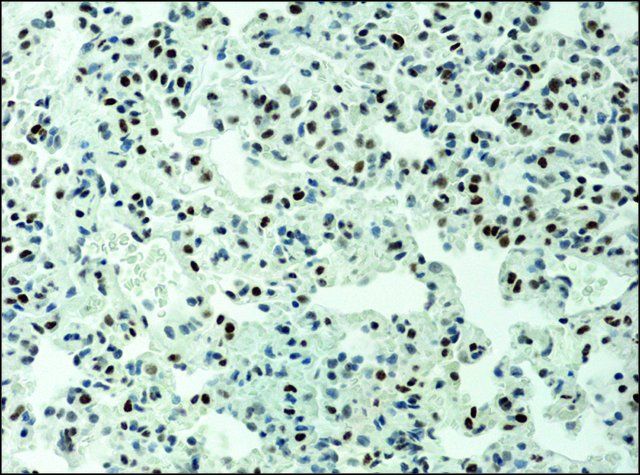
GTX12178 IHC-P Image
IHC-P analysis of rat lung tissue using GTX12178 Histone H3K9ac (acetyl Lys9) antibody at 0.1 ug/mL.
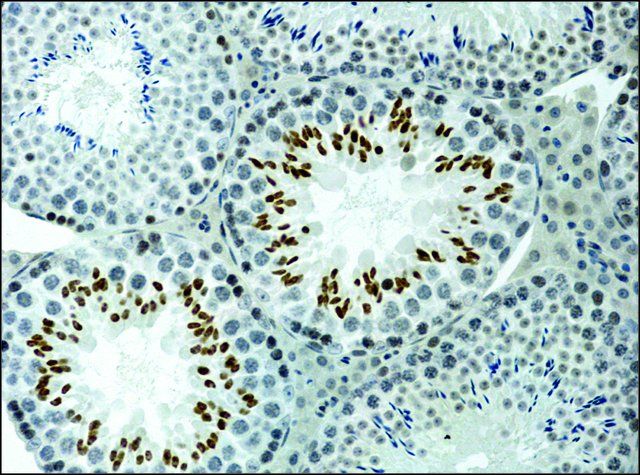
GTX12178 IHC-P Image
IHC-P analysis of mouse testis tissue using GTX12178 Histone H3K9ac (acetyl Lys9) antibody at 0.1 ug/mL.
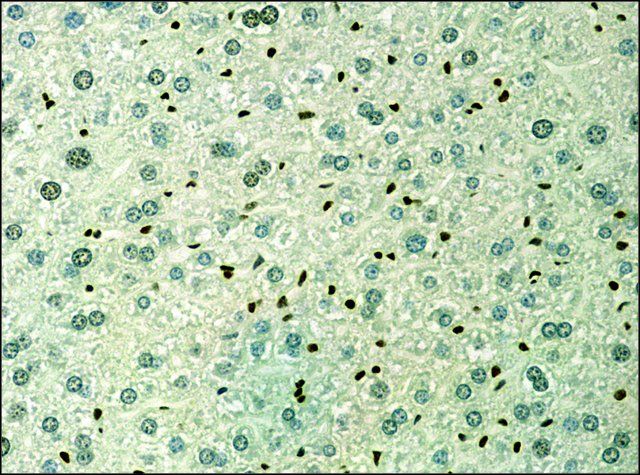
GTX12178 IHC-P Image
IHC-P analysis of mouse liver tissue using GTX12178 Histone H3K9ac (acetyl Lys9) antibody at 0.1 ug/mL.
 antibody.
<br>Lane 1 : Anti Histone H3K9ac (acetyl Lys9) antibody
<br>Lane 2 : Anti Histone H3K9ac (acetyl Lys9) + histone H3 (acetylated Lys9) peptide
<br>Lane 3 : Anti Histone H3K9ac (acetyl Lys9) + histone H3 peptide(non-acetylated) )